
Page 72 - THE PERCEPT STUDY Illness Perceptions in Physiotherapy Edwin de Raaij
P. 72
Chapter 3
70
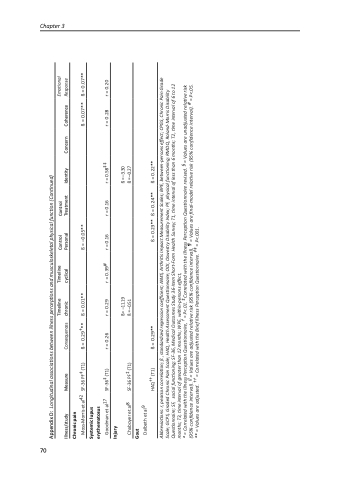
Appendix D: Longitudinal associations between illness perceptions and musculoskeletal physical function (Continued)
Illness/study
Measure
Consequences ß = 0.29†**
Timeline chronic
Timeline cyclical
Control Personal
Control Treatment
Identity
Concern
Coherence
Emotional Response
Chronic pain
Moss-Morris et al42
SF-36 PF‡ (T1)
ß = 0.01**
ß = –0.05** r = 0.16
ß = 0.07** r = 0.28
ß = 0.07** r = 0.20
Systemic lupus erythematosus
r = 0.39#
Goodman et al17
SF-36‡ (T1)
r = 0.26
r = 0.29
r = 0.16
r = 0.58‡‡
Injury
Chaboyer et al8
SF-36 PF‡ (T1)
ß= –11.19 ß =–0.51
ß =–3.30 ß =–0.27
Gout
Dalbeth et al9
HAQ†† (T1)
ß = 0.29**
ß = 0.23**
ß = 0.24**
ß = 0.22**
Abbreviations: r, pearson correlation; ß , standardized regression coefficient; AIMS, Arthritis Impact Measurement Scales; BPE, between-persons effect; CPGS, Chronic Pain Grade Scale; GCPS, Graded Chronic Pain Scale; HAQ, Health Assessment Questionnaire; ODI, Oswestry Disability Index; PF, physical functioning; RMDQ, Roland-Morris Disability Questionnaire; SF, social functioning; SF-36, Medical Outcomes Study 36-Item Short-Form Health Survey; T1, time interval of less than 6 months; T2, time interval of 6 to 12 months; T3, time interval of greater than 12 months; WPE, within-persons effect,
* = Correlated with the Illness Perception Questionnaire, † = P<.01. ‡Correlated with the Illness Perception Questionnaire revised. § = Values are unadjusted relative risk (95% confidence interval). ‖ = Values are adjusted relative risk (95% confidence interval). ¶ = Values are final-model relative risk (95% confidence interval). # = P<.05. ** = Values are adjusted. †† = Correlated with the Brief Illness Perception Questionnaire. ‡‡ = P<.001.
