
Page 68 - THE PERCEPT STUDY Illness Perceptions in Physiotherapy Edwin de Raaij
P. 68
Chapter 3
66
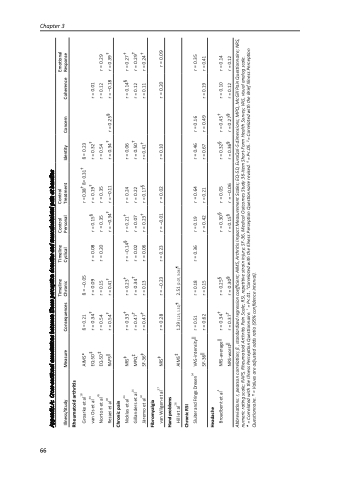
Appendix A: Cross-sectitional associatitions between illness perceptition domains and musculoskeletal pain at baseline
Illness/Study Measure
Consequences
Timeline Chronic
Timeline Cyclical
Control Personal
Control Treatment
Identity
Concern
Coherence
Emotional Response
Rheumatoid arthritis
Groarke et al18 AIMS* van Os et al56 EQ-5D‡ Norton et al45 EQ-5D‡ Rezaei et al48 RAPS‖
ß = 0.21
r = 0.34† r = 0.54
r = 0.54†
ß = –0.05 r = 0.09
r = 0.15
r = 0.41†
r = 0.08 r = 0.20
r = 0.15§
r = 0.35
r = –0.34†
r =0.38† ß= 0.31† r = 0.19†
r = 0.35
r = –0.11
ß = 0.23 r = 0.32† r = 0.54
r = 0.34†
r = 0.01 r = 0.12
r = –0.18
r = 0.29 r = 0.39†
Chronic pain
Nicklas et al44 NRS‡ Gillanders et al14 MPQ‡ Järemo et al32 SF-36‡
r = 0.33† r = 0.47† r = 0.47†
r = 0.23† r = 0.34† r = 0.13
r = –0.14§ r = 0.02
r = 0.06
r = 0.21† r = 0.07 r = 0.23†
r = 0.24 r = 0.22 r = 0.17§
r = 0.06 r = 0.50† r = 0.41†
r = 0.14§ r = 0.12
r = 0.11
r = 0.27† r = 0.29† r = 0.24†
Fibromyalgia
van Wilgen et al57 NRS‡
r = 0.28
1.29 (1.25, 1.32)¶ r = 0.51
r = –0.23
r = 0.23
r = –0.01
r = 0.02
r = 0.10
r = 0.20
r = 0.09
Hand problems
Hill et al26 AIMS‡
2.51 (2.07, 3.04)¶
Chronic RSI
Sluiter and Frings Dresen54 VAS-intensity‖
SF-36‖ r = 0.62
r = 0.18 r = 0.15
r = 0.36
r = 0.19 r = 0.42
r = 0.64 r = 0.21
r = 0.46 r = 0.67
r = 0.16 r = 0.49
r = 0.35 r = 0.41
Headache
Broadbent et al4 NRS-average‖
NRS-worst‖ r = 0.37†
r = 0.05
r = 0.10
r = 0.14
r = 0.34†
r = 0.25§
r = 0.30§
r = 0.32§
r = 0.45†
r = 0.30§
r = 0.15§
r = –0.06
r = 0.36§
r = 0.27§
r = 0.12
r = 0.12
Abbreviations: r, pearson correlation; ß , standardized regression coefficient; AIMS, Arthritis Impact Measurement Scales; EQ-5D, EuroQol-5 dimensions; MPQ, McGill Pain Questionnaire; NRS, numeric rating scale; RAPS, Rheumatoid Arthritis Pain Scale; RSI, repetitive strain injury; SF-36, Medical Outcomes Study 36-Item Short-Form Health Survey; VAS, visual analog scale.
* = Correlated with the Illness Perception Questionnaire. † = P<.01. ‡Correlated with the Illness Perception Questionnaire revised. § = P<.05. ‖ = Correlated with the Brief Illness Perception Questionnaire. ¶ = Values are adjusted odds ratio (95% confidence interval).
r = 0.25§
r = 0.19
