
Page 137 - THE PERCEPT STUDY Illness Perceptions in Physiotherapy Edwin de Raaij
P. 137
A multiple baseline single-case experimental design
135
7
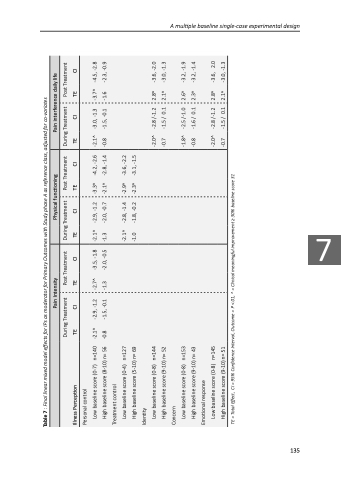
Table 7 : Final linear mixed model effects for IPs as moderator for Primary Outcomes with Study phase A as reference class, adjusted for co-variates
Illness Perception
TE
CI
TE
CI
TE CI
TE CI
TE CI
TE CI
Personal control
Low baseline score (0-7) n=140 High baseline score (8-10) n= 56
-2.1^ -0.8
-2.9, -1.2 -1.5, -0.1
-2.7^ -1.3
-3.5, -1.8 -2.0, -0.5
-2.1^ -2.9, -1.2 -1.3 -2.0, -0.7
-3.3^ -4.2, -2.6 -2.1^ -2.8, -1.4
-2.1^ -3.0, -1.3 -0.8 -1.5, -0.1
-3.7^ -4.5, -2.8 -1.6 -2.3, -0.9
Treatment control
Low baseline score (0-4) n=127 High baseline score (5-10) n= 69
-2.1^ -2.8, -1.4 -1.0 -1.8, -0.2
-2.9^ -3.6, -2.2 -2.3^ -3.1, -1.5
Identity
Low baseline score (0-8) n=144 High baseline score (9-10) n= 52
-2.0^ -2.8 /-1.2 -0.7 -1.5 / 0.1
2.8^ -3.6, -2.0 2.1^ -3.0, -1.3
Concern
Low baseline score (0-8) n=153 High baseline score (9-10) n= 43
-1.8^ -2.5 /-1.0 -0.8 -1.6 / 0.1
2.6^ -3.2, -1.9 2.3^ -3.2, -1.4
Emotional response
Low baseline score (0-8) n=145 High baseline score (9-10) n= 51
-2.0^ -2.8 /-1.2 -0.7 -1.5 / 0.1
2.8^ -3.6, 2.0 2.1^ -3.0, -1.3
During Treatment
Post Treatment
During Treatment
Post Treatment
During Treatment
Post Treatment
Pain Intensity
Physical functioning
Pain interference daily life
TE = Total Effect, CI = 95% Confidence Interval, Outcome = P <.01, ^ = Clinical meaningful improvement ≥ 30% baseline score 31
