
Page 116 - THE PERCEPT STUDY Illness Perceptions in Physiotherapy Edwin de Raaij
P. 116
Chapter 6
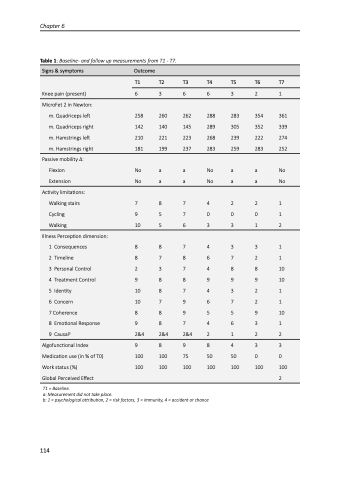
Table 1: Baseline- and follow up measurements from T1 - T7.
Signs & symptoms Outcome
T1 T2 T3 T4 T5 T6 T7
Knee pain (present) 6 3 6 6 3 2 1
MicroFet 2 in Newton:
m. Quadriceps left 258 260 262 288 283 354 361
m. Quadriceps right 142 140 145 289 305 352 339
m. Hamstrings left 210 221 223 268 239 222 274
m. Hamstrings right 181 199 237 283 259 283 252
Passive mobility ∆:
Flexion No a a No a a No
Extension No a a No a a No
Activity limitations:
Walking stairs 7 8 7 4 2 2 1
Cycling 9570001
Walking 10 5 6 3 3 1 2
Illness Perception dimension:
1 Consequences 8 8 7 4 3 3 1
2Timeline 8786721
3 Personal Control 2 3 7 4 8 8 10
4 Treatment Control 9 8 8 9 9 9 10
5Identity 10 8 7 4 3 2 1
6Concern 10 7 9 6 7 2 1
7 Coherence 8 8 9 5 5 9 10
8 Emotional Response 9 8 7 4 6 3 1
9 Causalb 2&4 2&4 2&4 2 1 2 2
Algofunctional Index 9 8 9 8 4 3 3
Medication use (in % of T0) 100 100 75 50 50 0 0
Work status (%) 100 100 100 100 100 100 100
Global Perceived Effect 2
T1 = Baseline.
a: Measurement did not take place.
b: 1 = psychological attribution, 2 = risk factors, 3 = immunity, 4 = accident or chance
114
