
Page 90 - A bird’s-eye view of recreation - Rogier Pouwels
P. 90
A bird's-eye view of recreation
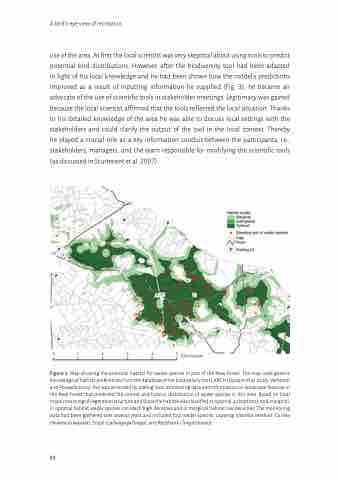
use of the area. At first the local scientist was very skeptical about using tools to predict potential bird distributions. However, after the biodiversity tool had been adapted in light of his local knowledge and he had been shown how the model's predictions improved as a result of inputting information he supplied (Fig. 3), he became an advocate of the use of scientific tools in stakeholder meetings. Legitimacy was gained because the local scientist affirmed that the tools reflected the local situation. Thanks to his detailed knowledge of the area he was able to discuss local settings with the stakeholders and could clarify the output of the tool in the local context. Thereby he played a crucial role as a key information conduit between the participants, i.e., stakeholders, managers, and the team responsible for modifying the scientific tools (as discussed in Sturtevant et al. 2007).
Figure 3. Map showing the potential habitat for wader species in part of the New Forest. The map used generic knowledge of habitat preferences from the database of the biodiversity tool LARCH (Opdam et al. 2003, Verboom and Pouwels 2004), but was amended by adding local monitoring data and information on landscape features in the New Forest that predicted the current and historic distribution of wader species in this area. Based on local maps consisting of vegetation structure and slope the habitat was classified as optimal, suboptimal, and marginal. In optimal habitat wader species can reach high densities and in marginal habitat low densities. The monitoring data had been gathered over several years and included four wader species: Lapwing (Vanellus vanellus), Curlew (Numenius arquata), Snipe (Gallinago gallinago), and Redshank (Tringa totanus).
012345
Kilometers
88
