
Page 66 - A bird’s-eye view of recreation - Rogier Pouwels
P. 66
A bird's-eye view of recreation
4.3 Method
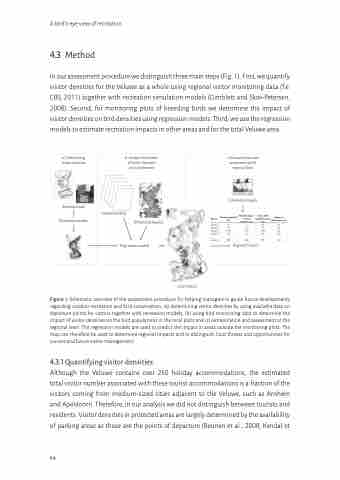
In our assessment procedure we distinguish three main steps (Fig. 1). First, we quantify visitor densities for the Veluwe as a whole using regional visitor monitoring data (f.e. CBS, 2011) together with recreation simulation models (Gimblett and Skov-Petersen, 2008). Second, for monitoring plots of breeding birds we determine the impact of visitor densities on bird densities using regression models. Third, we use the regression models to estimate recreation impacts in other areas and for the total Veluwe area.
Local impact
Figure 1. Schematic overview of the assessment procedure for helping managers to guide future developments regarding outdoor recreation and bird conservation; (a) determining visitor densities by using available data on departure points for visitors together with recreation models, (b) using bird monitoring data to determine the impact of visitor densities on the bird populations in the local plots and (c) extrapolation and assessment at the regional level. The regression models are used to predict the impact in areas outside the monitoring plots. The map can therefore be used to determine regional impacts and to distinguish local threats and opportunities for current and future visitor management.
4.3.1 Quantifying visitor densities
Although the Veluwe contains over 250 holiday accommodations, the estimated total visitor number associated with these tourist accommodations is a fraction of the visitors coming from medium-sized cities adjacent to the Veluwe, such as Arnhem and Apeldoorn. Therefore, in our analysis we did not distinguish between tourists and residents. Visitor densities in protected areas are largely determined by the availability of parking areas as these are the points of departure (Beunen et al., 2008, Kendal et
a. Determining visitor densities
Recreation data
Recreation models
b. Analyse the impact of visitor densities on bird densities
Habitat variables
Bird monitoring plots
Regression models
c. Extrapolation and assessment at the regional level
Conservation targets
Regional impact
Species
species 1
species 2
species 3
species 4
....
species n
Current population (bp)
90
50
1700
150
800
Modelled impact of visitor densities (bp)
0
10
-150
-25
-200
Natura 2000 population goal (bp)
100
50
1500
100
900
Impact on biodiversity goal
No
No
No
Yes
Yes
64
