
Page 49 - A bird’s-eye view of recreation - Rogier Pouwels
P. 49
decline. One of the reasons is a change in vegetation structure brought about by a decline of rabbits. The numbers of Skylark and Northern Wheatear (Oenanthe oenanthe) show a correlation to the number of rabbits (Koning & Baeyens 1990).
The case study models three scenarios for management of the dunes, including: no
recreation; the current pattern of recreational use; and a zoning scenario. In the zoning
scenario, the central part of the nature area was closed for recreation. For each scenario
both nature indicators (percentage of occupied patches and total numbers of Skylark)
and recreation indicators (overall recreation density and total length of paths with
low recreation densities) were assessed. The nature indicators were identified by the
managers of the area. The recreation indicators were determined by the researchers 3 after the study was conducted. We chose one indicator that relates to crowding and one
indicator that relates to opportunities for visitors that seek tranquility. The exploratory study illustrates the integrated use of the two models to manage a nature area for both ecological values and high quality recreational experiences.
Linking ecological and recreation models
recreation
nature
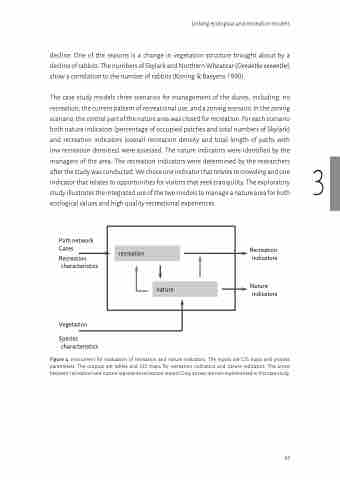
Path network Gates
Recreation characteristics
Vegetation
Species characteristics
Recreation indicators
Nature indicators
Figure 4. Instrument for evaluation of recreation and nature indicators. The inputs are GIS maps and process parameters. The outputs are tables and GIS maps for recreation indicators and nature indicators. The arrow between ‘recreation’ and ‘nature’ represents recreation impact. Grey arrows are not implemented in this case study.
47
