
Page 27 - A bird’s-eye view of recreation - Rogier Pouwels
P. 27
Developing tools and rules of thumb for managers
1: Data collection and preparation Single data points
routes of visitors
Frequency of path use 2
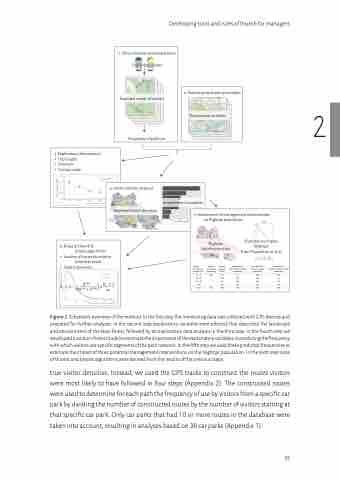
Figure 2. Schematic overview of the method. In the first step the monitoring data was collected with GPS devices and prepared for further analyses. In the second step explanatory variables were selected that described the landscape and environment of the New Forest, followed by an exploratory data analysis in the third step. In the fourth step we developed a random forest model to estimate the importance of the explanatory variables in predicting the frequency with which visitors use specific segments of the path network. In the fifth step we used these predicted frequencies to estimate the impact of three potential management interventions on the Nightjar population. In the sixth step rules of thumb and simple algorithms were derived from the results of the previous steps.
true visitor densities. Instead, we used the GPS tracks to construct the routes visitors were most likely to have followed in four steps (Appendix 2). The constructed routes were used to determine for each path the frequency of use by visitors from a specific car park by dividing the number of constructed routes by the number of visitors starting at that specific car park. Only car parks that had 10 or more routes in the database were taken into account, resulting in analyses based on 36 car parks (Appendix 1).
2: Selecting explanatory variables
Ex
planatory variables
3: Exploratory data analysis • Triplength
• Duration
• Tarmacroads
4: Visitor density analyses
Expected visitor densities
Importance of variables
5: Assessment of management interventions on Nightjar population
Nightjar distribution data
Disturbance impact Nightjar
From Pouwels et al. 2017
visitors
(x 1000 per year per ha)
without recreation (expected)
current (actual in 2004)
intervention 1: close small car parks (expected)
intervention 2: close 3 car parks (expected)
intervention 3: close all but 20 car parks (expected)
0 - 10 10 - 25 25 - 50
805 157 177 199 578 156 141 144 64 95 90 88 35
>50 90 92 85 28
total 805 498 500 515 705
6: Rules of thumb & simple algorithms
• locationofcarparksrelative to tarmac roads
• Impactopenness
𝑁𝑁𝑁𝑁𝑣𝑣𝑣𝑣=(1− 𝑑𝑑𝑑𝑑2.80 ×𝑉𝑉𝑉𝑉𝑐𝑐𝑐𝑐𝑐𝑐𝑐𝑐 ×2 9652.80 + 𝑑𝑑𝑑𝑑2.80 𝑐𝑐𝑐𝑐𝑑𝑑𝑑𝑑
25
