
Page 148 - A bird’s-eye view of recreation - Rogier Pouwels
P. 148
A bird's-eye view of recreation
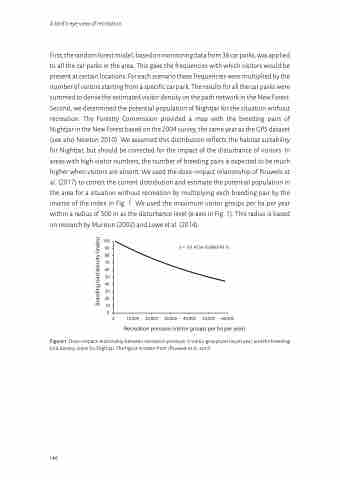
First, the random forest model, based on monitoring data from 36 car parks, was applied to all the car parks in the area. This gave the frequencies with which visitors would be present at certain locations. For each scenario these frequencies were multiplied by the number of visitors starting from a specific car park. The results for all the car parks were summed to derive the estimated visitor density on the path network in the New Forest. Second, we determined the potential population of Nightjar for the situation without recreation. The Forestry Commission provided a map with the breeding pairs of Nightjar in the New Forest based on the 2004 survey, the same year as the GPS dataset (see also Newton 2010). We assumed this distribution reflects the habitat suitability for Nightjar, but should be corrected for the impact of the disturbance of visitors. In areas with high visitor numbers, the number of breeding pairs is expected to be much higher when visitors are absent. We used the dose–impact relationship of Pouwels et al. (2017) to correct the current distribution and estimate the potential population in the area for a situation without recreation by multiplying each breeding pair by the inverse of the index in Fig. 1. We used the maximum visitor groups per ha per year within a radius of 500 m as the disturbance level (x-axis in Fig. 1). This radius is based on research by Murison (2002) and Lowe et al. (2014).
Figure 1. Dose–impact relationship between recreation pressure, in visitor groups per ha per year, and the breeding bird density index for Nightjar. The figure is taken from (Pouwels et al. 2017).
146
