
Page 58 - The clinical aspects and management of chronic migraine Judith Anne Pijpers
P. 58
Chapter 3
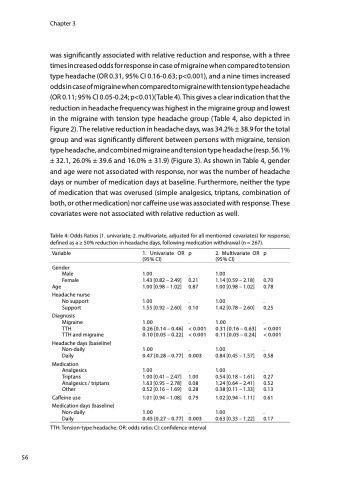
was significantly associated with relative reduction and response, with a three times increased odds for response in case of migraine when compared to tension type headache (OR 0.31, 95% CI 0.16-0.63; p<0.001), and a nine times increased odds in case of migraine when compared to migraine with tension type headache (OR 0.11; 95% CI 0.05-0.24; p<0.01)(Table 4). This gives a clear indication that the reduction in headache frequency was highest in the migraine group and lowest in the migraine with tension type headache group (Table 4, also depicted in Figure 2). The relative reduction in headache days, was 34.2% ± 38.9 for the total group and was significantly different between persons with migraine, tension type headache, and combined migraine and tension type headache (resp. 56.1% ± 32.1, 26.0% ± 39.6 and 16.0% ± 31.9) (Figure 3). As shown in Table 4, gender and age were not associated with response, nor was the number of headache days or number of medication days at baseline. Furthermore, neither the type of medication that was overused (simple analgesics, triptans, combination of both, or other medication) nor caffeine use was associated with response. These covariates were not associated with relative reduction as well.
Table 4: Odds Ratios (1. univariate; 2. multivariate, adjusted for all mentioned covariates) for response, defined as a ≥ 50% reduction in headache days, following medication withdrawal (n = 267).
Variable
Gender Male
Female Age
Headache nurse No support
Support
Diagnosis Migraine
TTH
TTH and migraine
Headache days (baseline) Non-daily
Daily
Medication Analgesics
Triptans
Analgesics / triptans Other
Caffeine use
Medication days (baseline) Non-daily
Daily
1. Univariate OR (95% CI)
1.00
1.43 [0.82 – 2.49] 1.00 [0.98 – 1.02]
1.00
1.55 [0.92 – 2.60]
1.00
0.26 [0.14 – 0.46] 0.10 [0.05 – 0.22]
1.00
0.47 [0.28 – 0.77]
1.00
1.00 [0.41 – 2.47] 1.63 [0.95 – 2.78] 0.52 [0.16 – 1.69]
1.01 [0.94 – 1.08]
1.00
0.45 [0.27 – 0.77]
p
. 0.21 0.87
. 0.10
.
< 0.001 < 0.001
. 0.003
. 1.00 0.08 0.28
0.79 .
0.003
2. Multivariate OR (95% CI)
1.00
1.14 [0.59 – 2.18] 1.00 [0.98 – 1.02]
1.00
1.42 [0.78 – 2.60]
1.00
0.31 [0.16 – 0.63] 0.11 [0.05 – 0.24]
1.00
0.84 [0.45 – 1.57]
1.00
0.54 [0.18 – 1.61] 1.24 [0.64 – 2.41] 0.38 [0.11 – 1.33]
1.02 [0.94 – 1.11]
1.00
0.63 [0.33 – 1.22]
p
. 0.70 0.78
. 0.25
.
< 0.001 < 0.001
. 0.58
. 0.27 0.52 0.13
0.61
. 0.17
56
TTH: Tension-type headache; OR: odds ratio; CI: confidence interval
