
Page 59 - Human Bile Acid Metabolism: a Postprandial Perspective
P. 59
A
600 400 200
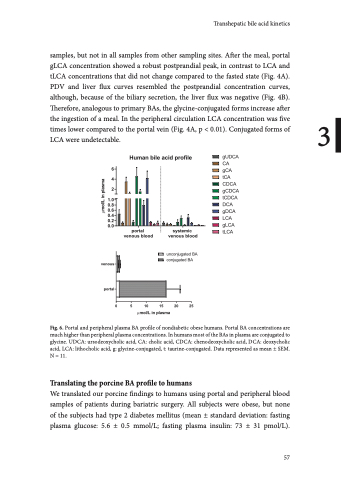
Fig. 6. Portal and peripheral plasma BA profile of nondiabetic obese humans. Portal BA concentrations are much higher than peripheral plasma concentrations. In humans most of the BAs in plasma are conjugated to glycine. UDCA: ursodeoxycholic acid, CA: cholic acid, CDCA: chenodeoxycholic acid, DCA: deoxycholic acid, LCA: lithocholic acid, g: glycine-conjugated, t: taurine-conjugated. Data represented as mean ± SEM. N = 11.
B PDV flux - minor bile acids
PDV flux - major bile acids
samples, but not in all samples from other sampling sites. After the meal, portal
gLCA concentration showed a robust postprandial peak, in contrast to LCA and
tLCA concentrations that did not change compared to the fasted state (Fig. 4A).
PDV and liver flux curves resembled the postprandial concentration curves,
although, because of the biliary secretion, the liver flux was negative (Fig. 4B).
Therefore, analogous to primary BAs, the glycine-conjugated forms increase after
the ingestion of a meal. In the peripheral circulation LCA concentration was five 3 times lower compared to the portal vein (Fig. 4A, p < 0.01). Conjugated forms of
LCA were undetectable.
Translating the porcine BA profile to humans
CDCA
Transhepatic bile acid kinetics
ke
release
ke release
time (min)
C Liver flux - major bile acids
D
Liver flux - minor bile acids
57
-200
-50
tCDCA 200 HDCA
We translated our porcine findings to humans using portal and peripheral blood
tHDCA
150
samples of patients during bariatric surgery. All subjects were obese, but none
100
of the subjects had type 2 diabetes mellitus (mean ± standard deviation: fasting
50
plasma glucose: 5.6 ± 0.5 mmol/L; fasting plasma insulin: 73 ± 31 pmol/L).
00 0 60 120 180 240
0 60 120 180 240 time (min)
0 50 0
