
Page 116 - Human Bile Acid Metabolism: a Postprandial Perspective
P. 116
Chapter 6
(Fig. 2, panel A). In general, CDCA was the largest contributor to the pool during the entire study, followed by DCA and CA respectively. Remarkably, the increase in plasma bile acids was completely caused by unconjugated bile acids (Fig. 2, panel B), which reached significance after 24 weeks. Expressed as the fraction of total bile acids, unconjugated bile acid AUC rose from a median of 22% (IQR 13%) at baseline to 26% (IQR 20%, p < 0.01**) at week 1 and 76% (IQR 19%, p < 0.01**) at week 24 after placement. Total glycine conjugates were unaltered after 24 weeks in contrast to the taurine conjugates that showed a ~90% reduction (Table 1). This pattern was also observed for the individual conjugated forms of CA, CDCA
AB
CD
E
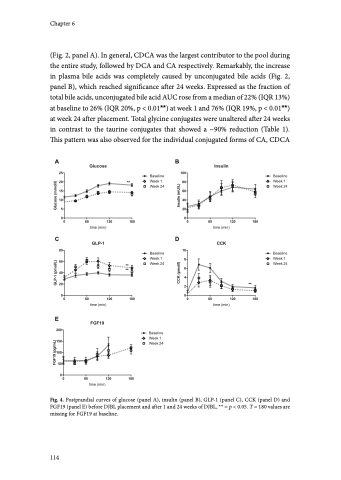
Fig. 4. Postprandial curves of glucose (panel A), insulin (panel B), GLP-1 (panel C), CCK (panel D) and FGF19 (panel E) before DJBL placement and after 1 and 24 weeks of DJBL, ** = p < 0.05. T = 180 values are missing for FGF19 at baseline.
114
