
Page 113 - Human Bile Acid Metabolism: a Postprandial Perspective
P. 113
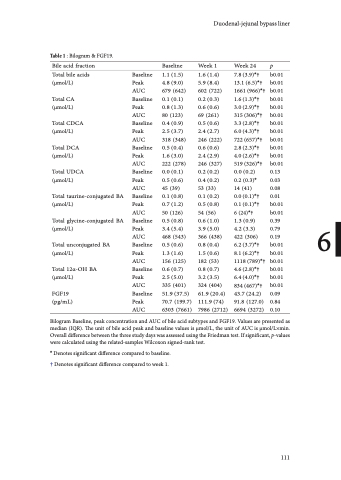
Table 1 : Bilogram & FGF19.
Bile acid fraction
Total bile acids Baseline (μmol/L) Peak
Baseline
1.1 (1.5)
Week1
1.6 (1.4) 5.9 (8.4) 602 (722) 0.2 (0.3) 0.6 (0.6)
69 (261)
0.5 (0.6) 2.4 (2.7) 246 (222) 0.6 (0.6) 2.4 (2.9) 246 (327) 0.2 (0.2) 0.4 (0.2)
53 (33)
0.1 (0.2) 0.5 (0.8)
54 (56)
0.6 (1.0) 3.9 (5.0) 366 (438) 0.8 (0.4) 1.5 (0.6) 182 (53)
0.8 (0.7) 3.2 (3.5) 324 (404) 61.9 (20.4) 111.9 (74) 7986 (2712)
Week 24 p
7.8 (3.9)*† b0.01
13.1 (6.5)*† b0.01
1661 (966)*† b0.01
1.6 (1.3)*† b0.01
3.0 (2.9)*† b0.01
315 (306)*† b0.01
3.3 (2.8)*† b0.01
6.0 (4.3)*† b0.01
722 (657)*† b0.01
2.8 (2.3)*† b0.01
4.0 (2.6)*† b0.01
519 (326)*† b0.01
0.0 (0.2) 0.13
0.2 (0.3)* 0.03
14 (41) 0.08
0.0 (0.1)*† 0.01
0.1 (0.1)*† b0.01
6 (24)*† b0.01
1.3 (0.9) 0.39 6 4.2 (3.3) 0.79
422 (306) 0.19 6.2 (3.7)*† b0.01 8.1 (6.2)*† b0.01 1118 (789)*† b0.01 4.6 (2.8)*† b0.01 6.4 (4.0)*† b0.01 834 (467)*† b0.01 43.7 (24.2) 0.09 91.8 (127.0) 0.84 6694 (3272) 0.10
Total CDCA Baseline (μmol/L) Peak
0.4 (0.9)
Total DCA Baseline (μmol/L) Peak
0.5 (0.4)
Total UDCA Baseline (μmol/L) Peak
0.0 (0.1)
Total taurine-conjugated BA Baseline (μmol/L) Peak
0.1 (0.8)
Total glycine-conjugated BA Baseline (μmol/L) Peak
0.5 (0.8)
Total 12α-OH BA Baseline (μmol/L) Peak
0.6 (0.7)
51.9 (37.5)
FGF19 Baseline (pg/mL) Peak
0.8 (1.3) AUC 80 (123)
2.5 (3.7) AUC 318 (348)
1.6 (3.0) AUC 222 (278)
0.5 (0.6) AUC 45 (39)
0.7 (1.2) AUC 50 (126)
Duodenal-jejunal bypass liner
  Total CA Baseline (μmol/L) Peak
0.1 (0.1)
4.8 (9.0) AUC 679 (642)
 Total unconjugated BA Baseline (μmol/L) Peak
0.5 (0.6)
3.4 (5.4) AUC 468 (543)
1.3 (1.6) AUC 156 (125)
2.5 (5.0) AUC 335 (401)
70.7 (199.7) AUC 6303 (7661)
 Bilogram Baseline, peak concentration and AUC of bile acid subtypes and FGF19. Values are presented as median (IQR). The unit of bile acid peak and baseline values is μmol/L, the unit of AUC is μmol/L×min. Overall difference between the three study days was assessed using the Friedman test. If significant, p-values were calculated using the related-samples Wilcoxon signed-rank test.
* Denotes significant difference compared to baseline. † Denotes significant difference compared to week 1.
111
