Page 29 -
P. 29
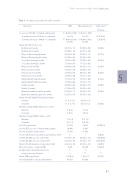
Table 3. Secondary outcomes at 8 and 52 weeks*
% success (95% CI) on shuttle walking test: 8 weeks (increase of 80 m or complete)
52 weeks (increase of 80 m or complete)
Mean (95% CI) SF-36 score: Bodily pain 8 weeks
Bodily pain 52 weeks
Physical functioning 8 weeks Physical functioning 52 weeks Social functioning 8 weeks Social functioning 52 weeks Physical role 8 weeks
Physical role 52 weeks Emotional role 8 weeks Emotional role 52 weeks Mental health index 8 weeks Mental health index 52 weeks Vitality 8 weeks
Vitality 52 weeks
General health perception 8 weeks General health perception 52 weeks
Mean (95% CI) McGill Pain Questionnaire: 8 weeks
52 weeks
Median (range) HADS depression score§:
Baseline
52 weeks
Median (range) HADS anxiety score§:
Baseline
52 weeks
No (%) reoperations
No (%) ZCQ success of reoperated patients
No (%) operated at two levels
No of reoperations in patients operated at 2 levels % (95% CI) ZCQ success at 8 weeks
% (95% CI) ZCQ success at 52 weeks
Mean (95% CI) duration of operation (min)
Blood loss (mL)—categorized¶
Complications during hospital stay
Spinous process fractures
Mean (SD) hospital stay
No (%) blinded to allocated treatment
57 (0.45 to 0.68) (n=73)
57 (0.43 to 0.69) (n=66)
66 (61 to 71) 66 (60 to 72) 64 (59 to 70) 63 (58 to 69) 74 (69 to 80) 77 (70 to 83) 44 (34 to 54) 55 (45 to 65) 74 (65 to 83) 74 (65 to 83) 77 (73 to 81) 75 (70 to 80) 64 (60 to 68) 61 (56 to 66) 67 (63 to 71) 62 (57 to 67)
11 (9 to 12) 11 (9 to 13)
4 (0-9) 3 (0-9)
7 (2-14)
6 (1-12) 21 (29) 10 (48) 21 (26)
8
67 (45 to 83) 49 (29 to 69) 24 (22 to 26) 10-50
5
3
1.83 (0.9) XX (67)
59 (0.47 to 0.88) (n=72)
51 (0.40 to 0.62) (n=70)
63 (58 to 68) 62 (57 to 68) 67 (62 to 72) 62 (56 to 68) 76 (70 to 82) 77 (72 to 82) 42 (33 to 51) 55 (46 to 65) 80 (72 to 88) 79 (71 to 87) 76 (72 to 80) 75 (71 to 79) 62 (58 to 67) 59 (55 to 64) 63 (59 to 67) 59 (55 to 63)
10 (8 to 12) 10 (9 to 12)
3 (1-9) 3 (0-9)
6 (2-12)
6 (0-14)
6 (8%)
3 (50)
16 (18)
1
48 (24 to 73) 53 (25 to 79) 43 (39 to 47) 50-100
6
**
1.89 (1.2) XX (86)
0.75 (0.33) 1.25 (0.54)
(0.40)‡ (0.72)‡ (0.95)‡ (0.96)‡ (0.46)‡ (0.92)‡ (0.60)‡ (0.34)‡
(0.70)‡
(<0.001)§
(0.03)§ 2.50 (0.06) 0.83 (0.83) (<0.001) (<0.001)
** (0.753)
Felix: one-year results and subgroups
Outcome
IPD
Decompression
Odds ratio† (P value)
81
5