
Page 59 - When surgery alone won’t cut it - Valerie Maureen Monpellier
P. 59
Weight change
Mean baseline BMI was 44.4 kg/m2 (range 30.3 – 75.7 kg/m2, Table 1). Mean TWL at 12 months after surgery was 30.8%, at 15 months this was 31.6% and at 24 month 31.4%. Mean TWLmax was 32.7% (±7.9).
Mean TWL was 29.2% at 36-month FU and 27.3% at 48-month FU (p<0.001). Mean 36mWR was 5.3% ±6.7 and the mean 48mWR was 7.2% ±9.2 (p<0.001).
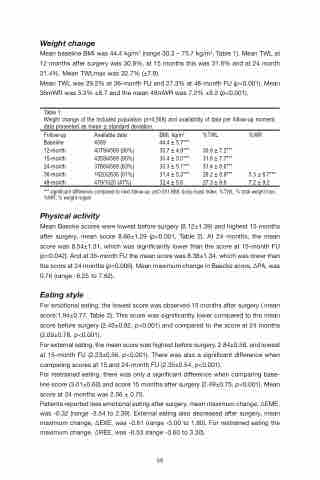
Table 1:
Weight change of the included population (n=4,569) and availability of data per follow-up moment,
data presented as mean ± standard deviation.
BMI, kg/m2 %TWL
44.4 ± 5.7***
30.7 ± 4.9*** 30.8 ± 7.2*** 30.4 ± 5.0*** 31.6 ± 7.7*** 30.3 ± 5.1*** 31.4 ± 8.6*** 31.4 ± 5.3*** 29.2 ± 8.9*** 32.4 ± 5.6 27.3 ± 9.6
%WR
5.3 ± 6.7*** 7.2 ± 9.2
Follow-up Baseline 12-month 15-month 24-month 36-month 48-month
Available data 4569
4079/4569 (90%) 4359/4569 (95%) 3786/4569 (83%) 1620/2636 (61%) 479/1020 (47%)
*** significant difference compared to next follow-up, p≤0.001.BMI: body mass index, %TWL: % total weight loss; %WR: % weight regain
Physical activity
Mean Baecke scores were lowest before surgery (8.12±1.39) and highest 15 months after surgery, mean score 8.66±1.29 (p<0.001, Table 2). At 24 months, the mean score was 8.54±1.31, which was significantly lower than the score at 15-month FU (p=0.042). And at 36-month FU the mean score was 8.38±1.34, which was lower than the score at 24 months (p=0.006). Mean maximum change in Baecke score, ΔPA, was 0.76 (range -6.25 to 7.62).
Eating style
For emotional eating, the lowest score was observed 15 months after surgery ( mean score:1.94±0.77, Table 2). This score was significantly lower compared to the mean score before surgery (2.43±0.82, p<0.001) and compared to the score at 24 months (2.09±0.78, p<0.001).
For external eating, the mean score was highest before surgery, 2.84±0.58, and lowest at 15-month FU (2.23±0.56, p<0.001). There was also a significant difference when comparing scores at 15 and 24-month FU (2.35±0.54, p<0.001).
For restrained eating, there was only a significant difference when comparing base- line score (3.01±0.60) and score 15 months after surgery (2.49±0.75, p<0.001). Mean score at 24 months was 2.56 ± 0.75.
Patients reported less emotional eating after surgery, mean maximum change, ΔEME, was -0.32 (range -3.54 to 2.39). External eating also decreased after surgery, mean maximum change, ΔEXE, was -0.61 (range -3.00 to 1.80). For restrained eating the maximum change, ΔREE, was -0.53 (range -3.60 to 3.30).
59
