
Page 123 - When surgery alone won’t cut it - Valerie Maureen Monpellier
P. 123
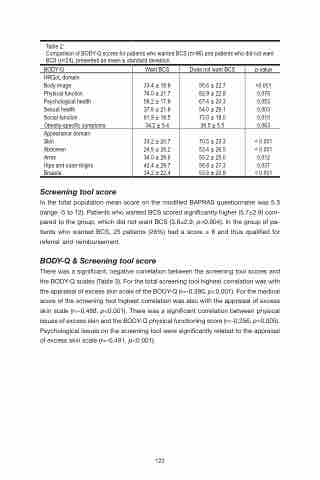
 Table 2:
Comparison of BODY-Q scores for patients who wanted BCS (n=96) and patients who did not want BCS (n=24), presented as mean ± standard deviation.
BODY-Q                             p-value
HRQoL domain Body image Physical function Psychological health Sexual health
Social function
Obesity-specific symptoms                           0.063
Appearance domain Skin
Abdomen
Arms
Hips and outer thighs
Breasts                     < 0.001
Screening tool score
In the total population mean score on the modified BAPRAS questionnaire was 5.3 (range -5 to 12). Patients who wanted BCS scored significantly higher (5.7±2.9) com- pared to the group, which did not want BCS (3.8±2.9, p=0.004). In the group of pa- tients who wanted BCS, 25 patients (26%) had a score ≥ 8 and thus qualified for referral and reimbursement.
BODY-Q & Screening tool score
There was a significant, negative correlation between the screening tool scores and the BODY-Q scales (Table 3). For the total screening tool highest correlation was with the appraisal of excess skin scale of the BODY-Q (r=-0.390, p<0.001). For the medical score of the screening tool highest correlation was also with the appraisal of excess skin scale (r=-0.488, p<0.001). There was a significant correlation between physical issues of excess skin and the BODY-Q physical functioning score (r=-0.256, p=0.005). Psychological issues on the screening tool were significantly related to the appraisal of excess skin scale (r=-0.491, p<0.001).
Want BCS
Does not want BCS
33.4 ± 18.9 74.0 ± 21.7 59.2 ± 17.9 37.6 ± 21.8 61.9 ± 18.5 34.2 ± 5.4
        55.6 ± 22.7 82.9 ± 22.8 67.4 ± 20.3 54.0 ± 29.1 73.0 ± 19.0 36.5 ± 5.5
    33.2 ± 20.7 24.5 ± 26.2 34.0 ± 28.6 42.4 ± 29.7 34.2 ± 22.4
      70.5 ± 23.3 53.4 ± 26.5 50.2 ± 25.0 56.8 ± 27.3 53.6 ± 20.9
   <0.001 0.076 0.053 0.003 0.010
< 0.001 < 0.001 0.012 0.037
123
