
Page 53 - New epidemiological and PSMA-expression based paradigms in salivary gland tumors
P. 53
$! % ! # "$# $# %# !$!!" "% % ! !#" ! $# ! % !"
" !# " $# $#" " $ # $!"
Natural history of recurrent pleomorphic adenoma
-$$' %&)
3
&)- % 1 &-0 -',0
%+ 1 $&0 *&0
1,+&+
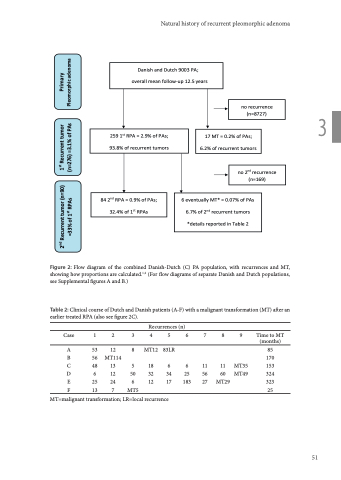
Figure 2: Flow diagram of the combined Danish-Dutch (C) PA population, with recurrences and MT, showing how proportions are calculated.1,2 (For flow diagrams of separate Danish and Dutch populations, see Supplemental figures A and B.)
Table 2: Clinical course of Dutch and Danish patients (A-F) with a malignant transformation (MT) after an earlier treated RPA (also see figure 2C).
Recurrences (n)
Case 1 2 3 4 5 6 7 8 9 Time to MT (months)
A 53128MT1283LR 85
B 56 MT114 170
C 48 13 5 18 6 6 11 11 MT35 153
D 6 12 50 32 34 25 56 60 MT49 324
E 25 24 6 12 17 183 27MT29 323
F 13 7 MT5 25
MT=malignant transformation; LR=local recurrence
* ! 1 $$+0 *+0 & ! &
& 1%*-
,( & 1 $-0 '&(0 %
51
$
$# $ $#
