
Page 261 - Personalised medicine of fluoropyrimidines using DPYD pharmacogenetics Carin Lunenburg
P. 261
Phenotyping assays for predicting DPD deficiency
10
259
assays to patients from the main study cohort. We used a non-parametric test for independent samples to compare medians of age, BSA and number of treatment cycles; and a χ2 test for gender, ethnic origin, treatment regimen and WHO status.
Abbreviations: IQR: interquartile range; CRC: colorectal cancer; BC: breast cancer; GC: gastric cancer; CAP mono: capecitabine monotherapy (with or without bevacizumab); CAP + RT: capecitabine combined with radiotherapy (with or without mitomycin); CAPOX: capecitabine combined with oxaliplatin (with or without bevacizumab); CAP other: capecitabine combined with other anticancer drugs; 5-FU mono: 5-fluorouracil monotherapy; 5-FU + RT: 5-fluorouracil combined with radiotherapy (with or without mitomycin); FOLFOX: 5-fluorouracil combined with oxaliplatin and leucovorin (with or without bevacizumab); 5-FU other: 5-fluorouracil combined with other anticancer drugs; BSA: body surface area; WHO: world health organisation; NS: not specified, either WHO 0, 1 or 2; ND: not done; DPYD; gene encoding dihydropyrimidine dehydrogenase.
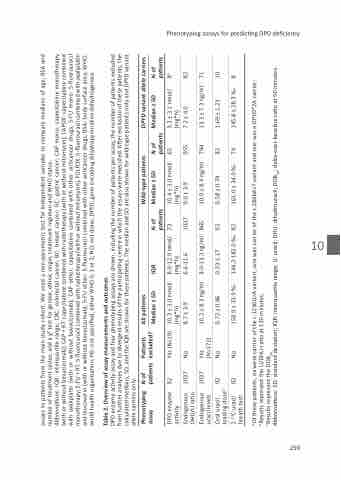
Table 2. Overview of assay measurements and outcomes
DPD enzyme activity assay and four phenotyping assays are shown, including the number of patients per assay, the number of patients excluded from further analyses due to divergent results of the participating centre in which the assays were executed. After exclusion of these patients, the calculated medians, SD, and the IQR are shown for these patients. The median and SD are also shown for wild-type patients only and DPYD variant allele carriers only.
Phenotyping assay
N of Patients patients excluded?
All patients Median ± SD
Wild-type patients
DPYD variant allele carriers
DPD enzyme 92 activity
Yes (N=19)
10.3 ± 3.0 nmol/ (mg*h)
8.0-12.9 nmol/ 73 10.4 ± 3.0 nmol/ 65 (mg*h) (mg*h)
9.2 ± 3.1 nmol/ 8a (mg*h)
Endogenous 1037 DHU/U ratio
No
8.7 ± 3.9
10.2 ± 8.3 ng/ml 0.72 ± 0.86 158.9 ± 33.9 ‰
6.6-11.6 1037 9.0 ± 3.9 955 8.0-13.3 ng/ml 865 10.0 ± 8.4 ng/ml 794 0.33-1.17 92 0.58 ± 0.74 82 144.2-182.0 ‰ 82 161.0 ± 34.0 ‰ 74
7.2 ± 4.0 82 13.3 ± 7.3 ng/ml 71 1.69 ± 1.23 10 145.8 ± 28.3 ‰ 8
Endogenous 1037
Yes uracil levels (N=172)
Oral uracil 92 loading doseb
No No
2-13C-uracil 82 breath testc
IQR N of Median ± SD N of patients patients
Median ± SD
N of patients
a Of these patients, six were carrier of the c.1236G>A variant, one was carrier of the c.2846A>T variant and one was a DPYD*2A carrier;
b Results represent the U/DHU-ratio at 120 minutes;
c Results represent the DOB50.
Abbreviations: SD: standard deviation; IQR: interquartile range; U: uracil; DHU: dihydrouracil; DOB50: delta-over-baseline ratio at 50 minutes.
