
Page 31 - Exploring the Potential of Self-Monitoring Kidney Function After Transplantation - Céline van Lint
P. 31
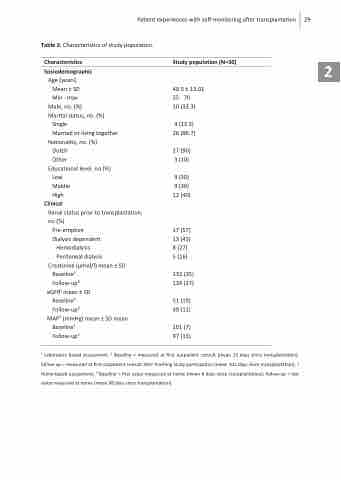
 Table 2. Characteristics of study population.
Characteristics Sociodemographic
Age (years) Mean ± SD Min - max
Male, no. (%)
Marital status, no. (%)
Single
Married or living together Nationality, no. (%)
Dutch
Other
Educational level, no (%)
Low Middle High
Clinical
Renal status prior to transplantation, no (%)
Pre-emptive Dialysis dependent
Hemodialysis
Peritoneal dialysis Creatinine (μmol/l) mean ± SD
Baseline2
Follow-up2 eGFR1 mean ± SD
Baseline2
Follow-up2
MAP3 (mmHg) mean ± SD mean
Baseline4 Follow-up4
Study population (N=30)
49.5 ± 13.01 25-70
10 (33.3)
4 (13.3) 26 (86.7)
27 (90) 3 (10)
9 (30)
9 (30) 12 (40)
17 (57) 13 (43) 8 (27) 5 (16)
132 (35) 134 (37)
51 (19) 49 (11)
101 (7) 97 (13)
Patient experiences with self-monitoring after transplantation 29
      1 Laboratory based assessment; 2 Baseline = measured at first outpatient consult (mean 13 days since transplantation); follow-up = measured at first outpatient consult after finishing study participation (mean 101 days since transplantation); 3 Home-based assessment; 4 Baseline = first value measured at home (mean 8 days since transplantation); follow-up = last value measured at home (mean 88 days since transplantation).
2
