
Page 141 - Exploring the Potential of Self-Monitoring Kidney Function After Transplantation - Céline van Lint
P. 141
Self-monitoring: the reliability of patient-reported data 139
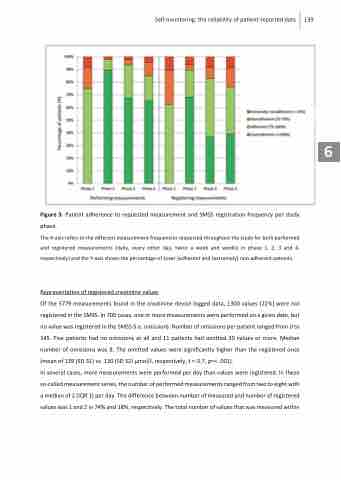
Figure 3. Patient adherence to requested measurement and SMSS registration frequency per study phase.
The X-axis refers to the different measurement frequencies requested throughout the study for both performed and registered measurements (daily, every other day, twice a week and weekly in phase 1, 2, 3 and 4, respectively) and the Y-axis shows the percentage of (over-)adherent and (extremely) non-adherent patients.
Representation of registered creatinine values
Of the 5779 measurements found in the creatinine device logged data, 1300 values (22%) were not registered in the SMSS. In 700 cases, one or more measurements were performed on a given date, but no value was registered in the SMSS (i.e. omission). Number of omissions per patient ranged from 0 to 145. Five patients had no omissions at all and 11 patients had omitted 20 values or more. Median number of omissions was 8. The omitted values were significantly higher than the registered ones (mean of 139 (SD 31) vs. 130 (SD 32) μmol/l, respectively, t =-3.7, p=< .001).
In several cases, more measurements were performed per day than values were registered. In these so-called measurement series, the number of performed measurements ranged from two to eight with a median of 2 (IQR 1) per day. The difference between number of measured and number of registered values was 1 and 2 in 74% and 18%, respectively. The total number of values that was measured within
6
