
Page 110 - Exploring the Potential of Self-Monitoring Kidney Function After Transplantation - Céline van Lint
P. 110
108
Chapter 5
intervention and control group (number of outpatient visits, number of telephonic consults and amount of self-management behaviour), both intention-to-treat and per protocol analyses were performed.
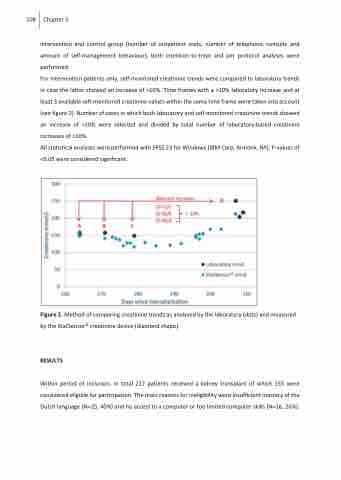
For intervention patients only, self-monitored creatinine trends were compared to laboratory trends in case the latter showed an increase of >10%. Time frames with a >10% laboratory increase and at least 3 available self-monitored creatinine values within the same time frame were taken into account (see figure 2). Number of cases in which both laboratory and self-monitored creatinine trends showed an increase of >10% were selected and divided by total number of laboratory-based creatinine increases of >10%.
All statistical analyses were performed with SPSS 23 for Windows (IBM Corp, Armonk, NY). P-values of <0.05 were considered significant.
Figure 2. Method of comparing creatinine trends as analysed by the laboratory (dots) and measured by the StatSensor® creatinine device (diamond shape).
RESULTS
Within period of inclusion, in total 217 patients received a kidney transplant of which 155 were considered eligible for participation. The main reasons for ineligibility were insufficient mastery of the Dutch language (N=25, 40%) and no access to a computer or too limited computer skills (N=16, 26%).
