
Page 141 - Synthesis of Functional Nanoparticles Using an Atmospheric Pressure Microplasma Process - LiangLiang Lin
P. 141
Rare Earth Doped Yttrium Oxide Nanophosphors Synthesis and Engineering- Controllable Photoluminescence Properties
EDX analysis is performed to examine the chemical composition of the nanophosphors, which shows the presence of Y, O, Eu and C (from carbon tape) elements. The EDX mapping on a random area indicates Y and O as dominant elements. Meanwhile, Eu element shows relatively low signal homogenously distributed over the sample area, suggesting it is uniformly incorporated in the products (Supplementary Material Figure S2).
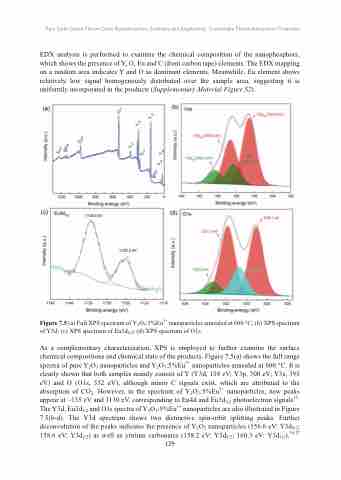
Figure 7.5 (a) Full XPS spectrum of Y2O3:5%Eu3+ nanoparticles annealed at 600 °C; (b) XPS spectrum of Y3d; (c) XPS spectrum of Eu3d5/2; (d) XPS spectrum of O1s.
As a complementary characterization, XPS is employed to further examine the surface chemical compositions and chemical state of the products. Figure 7.5(a) shows the full range spectra of pure Y2O3 nanoparticles and Y2O3:5%Eu3+ nanoparticles annealed at 600 °C. It is clearly shown that both samples mainly consist of Y (Y3d, 158 eV; Y3p, 300 eV; Y3s, 395 eV) and O (O1s, 532 eV), although minor C signals exist, which are attributed to the absorption of CO2. However, in the spectrum of Y2O3:5%Eu3+ nanoparticles, new peaks appear at ~135 eV and 1130 eV, corresponding to Eu4d and Eu3d5/2 photoelectron signals15. The Y3d, Eu3d5/2 and O1s spectra of Y2O3:5%Eu3+ nanoparticles are also illustrated in Figure 7.5(b-d). The Y3d spectrum shows two distinctive spin-orbit splitting peaks. Further deconvolution of the peaks indicates the presence of Y2O3 nanoparticles (156.6 eV: Y3d5/2; 158.6 eV: Y3d3/2) as well as yttrium carbonates (158.2 eV: Y3d5/2; 160.3 eV: Y3d3/2).16,17 129
