
Page 122 - Synthesis of Functional Nanoparticles Using an Atmospheric Pressure Microplasma Process - LiangLiang Lin
P. 122
Chapter 6
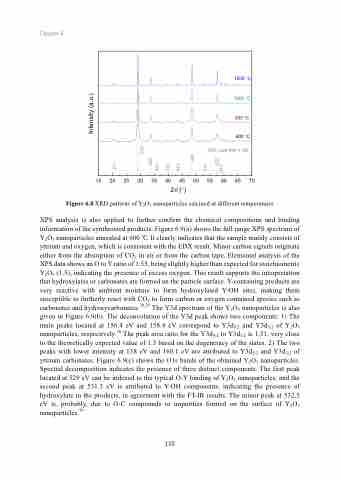
1200 °C
1000 °C
800 °C
600 °C PDF card #41-1105
15 20 25 30 35 40 45 50 55 60 65 70
2q (°)
Figure 6.8 XRD patterns of Y2O3 nanoparticles calcined at different temperatures
XPS analysis is also applied to further confirm the chemical compositions and binding information of the synthesized products. Figure 6.9(a) shows the full range XPS spectrum of Y2O3 nanoparticles annealed at 600 °C. It clearly indicates that the sample mainly consists of yttrium and oxygen, which is consistent with the EDX result. Minor carbon signals originate either from the absorption of CO2 in air or from the carbon tape. Elemental analysis of the XPS data shows an O to Y ratio of 1.55, being slightly higher than expected for stoichiometric Y2O3 (1.5), indicating the presence of excess oxygen. This result supports the interpretation that hydroxylates or carbonates are formed on the particle surface. Y-containing products are very reactive with ambient moisture to form hydroxylated Y-OH sites, making them susceptible to furtherly react with CO2 to form carbon or oxygen contained species such as carbonates and hydroxycarbonates.28,29 The Y3d spectrum of the Y2O3 nanoparticles is also given in Figure 6.9(b). The deconvolution of the Y3d peak shows two components: 1) The main peaks located at 156.4 eV and 158.4 eV correspond to Y3d5/2 and Y3d3/2 of Y2O3 nanoparticles, respectively.30 The peak area ratio for the Y3d5/2 to Y3d3/2 is 1.51, very close to the theoretically expected value of 1.5 based on the degeneracy of the states. 2) The two peaks with lower intensity at 158 eV and 160.1 eV are attributed to Y3d5/2 and Y3d3/2 of yttrium carbonates. Figure 6.9(c) shows the O1s bands of the obtained Y2O3 nanoparticles. Spectral decomposition indicates the presence of three distinct components. The first peak located at 529 eV can be indexed to the typical O-Y binding of Y2O3 nanoparticles, and the second peak at 531.3 eV is attributed to Y-OH components, indicating the presence of hydroxylate in the products, in agreement with the FT-IR results. The minor peak at 532.5 eV is, probably, due to O-C compounds or impurities formed on the surface of Y2O3 nanoparticles.30
211
400 411
332 431
440 611
631622
222
Intensity (a.u.)
110
