
Page 119 - Synthesis of Functional Nanoparticles Using an Atmospheric Pressure Microplasma Process - LiangLiang Lin
P. 119
Yttrium Oxide Nanoparticles Synthesis - a Model Study on the Plasma-Liquid Interaction and Opener to Nanophosphors
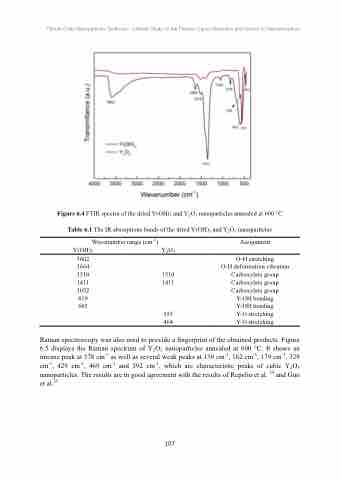
Figure 6.4 FTIR spectra of the dried Y(OH)3 and Y2O3 nanoparticles annealed at 600 °C Table 6.1 The IR absorptions bands of the dried Y(OH)3 and Y2O3 nanoparticles
Wavenumber range (cm-1) Y(OH)3 Y2O3
3602
1664
1510 1510 1411 1411 1052
Assignment
O-H stretching
O-H deformation vibration Carboxylate group Carboxylate group Carboxylate group Y-OH bending Y-OH bending
Y-O stretching
Y-O stretching
819 603
555 464
Raman spectroscopy was also used to provide a fingerprint of the obtained products. Figure 6.5 displays the Raman spectrum of Y2O3 nanoparticles annealed at 600 °C. It shows an intense peak at 378 cm-1 as well as several weak peaks at 130 cm-1, 162 cm-1, 179 cm-1, 329 cm-1, 429 cm-1, 469 cm-1 and 592 cm-1, which are characteristic peaks of cubic Y2O3 nanoparticles. The results are in good agreement with the results of Repelin et al. 24 and Guo et al.25
107
