
Page 164 - Children’s mathematical development and learning needs in perspective of teachers’ use of dynamic math interviews
P. 164
Chapter 5
of process-oriented (51.1%) over product-oriented (8.5%) questions. No questions were asked to actively involve the child. Verbal support, provided by notes by the teacher, was provided. Responsiveness and Summarizing the needs of the child were rated as low. And the interview was judged to have a restricted scope (b). The child’s mathematical development nevertheless increased from 183 (T1) to 229 (T2) for mathematical problem-solving ability and from 68 (T1) to 104 (T2) for arithmetic fluency. In addition, the child’s math self-efficacy and self-concept increased while math anxiety decreased. No explicit math learning needs were identified during this dynamic math interview.
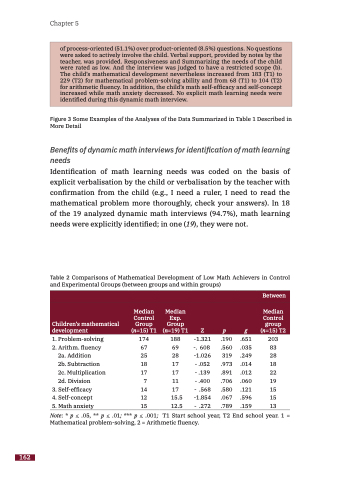
Figure 3 Some Examples of the Analyses of the Data Summarized in Table 1 Described in More Detail
Benefits of dynamic math interviews for identification of math learning needs
Identification of math learning needs was coded on the basis of explicit verbalisation by the child or verbalisation by the teacher with confirmation from the child (e.g., I need a ruler, I need to read the mathematical problem more thoroughly, check your answers). In 18 of the 19 analyzed dynamic math interviews (94.7%), math learning needs were explicitly identified; in one (19), they were not.
Table 2 Comparisons of Mathematical Development of Low Math Achievers in Control and Experimental Groups (between groups and within groups)
Between
Children’s mathematical development
Median Control Group (n=15) T1
Median Exp. Group (n=19) T1
Z
p
g
Median Control group (n=15) T2
1. Problem-solving 174 188 -1.321
2. Arithm. fluency 2a. Addition
2b. Subtraction 2c. Multiplication 2d. Division
3. Self-efficacy
4. Self-concept
5. Math anxiety
Note: * p < .05, ** p < .01; *** p < .001;
Mathematical problem-solving, 2 = Arithmetic fluency.
.190 .651 203 .560 .035 83 319 .249 28 .973 .014 18 .891 .012 22 .706 .060 19 .580 .121 15 .067 .596 15 .789 .159 13
-. 608 -1.026 - .052 - .139 - .400 - .568 15.5 -1.854 15 12.5 - .272
67 25 18 17
69
28
17
17
11
17
7 14 12
162
T1 Start school year, T2 End school year. 1 =
