
Page 130 - Children’s mathematical development and learning needs in perspective of teachers’ use of dynamic math interviews
P. 130
128
Chapter 4
Effect of the intervention on teacher factors of mathematics teaching
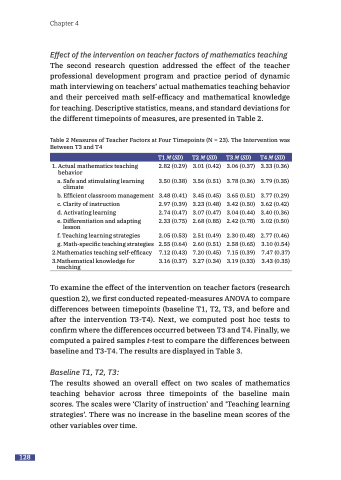
The second research question addressed the effect of the teacher professional development program and practice period of dynamic math interviewing on teachers’ actual mathematics teaching behavior and their perceived math self-efficacy and mathematical knowledge for teaching. Descriptive statistics, means, and standard deviations for the different timepoints of measures, are presented in Table 2.
Table 2 Measures of Teacher Factors at Four Timepoints (N = 23). The Intervention was Between T3 and T4
T1 M (SD)
T2 M (SD)
T3 M (SD)
T4 M (SD)
1. Actual mathematics teaching behavior
a. Safe and stimulating learning climate
b. Efficient classroom management
c. Clarity of instruction
d. Activating learning
e. Differentiation and adapting lesson
f. Teaching learning strategies
g. Math-specific teaching strategies
2.Mathematics teaching self-efficacy
3.Mathematical knowledge for teaching
2.82 (0.29) 3.50 (0.38)
3.48 (0.41) 2.97 (0.39) 2.74 (0.47) 2.33 (0.75)
2.05 (0.53) 2.55 (0.64) 7.12 (0.43) 3.16 (0.37)
3.01 (0.42) 3.56 (0.51)
3.45 (0.45) 3.23 (0.48) 3.07 (0.47) 2.68 (0.85)
2.51 (0.49) 2.60 (0.51) 7.20 (0.45) 3.27 (0.34)
3.06 (0.37) 3.78 (0.36)
3.65 (0.51) 3.42 (0.50) 3.04 (0.44) 2.42 (0.78)
2.30 (0.48) 2.58 (0.65) 7.15 (0.39) 3.19 (0.33)
3.33 (0.36) 3.79 (0.35)
3.77 (0.29) 3.62 (0.42) 3.40 (0.36) 3.02 (0.50)
2.77 (0.46) 3.10 (0.54) 7.47 (0.37) 3.43 (0.35)
To examine the effect of the intervention on teacher factors (research question 2), we first conducted repeated-measures ANOVA to compare differences between timepoints (baseline T1, T2, T3, and before and after the intervention T3-T4). Next, we computed post hoc tests to confirm where the differences occurred between T3 and T4. Finally, we computed a paired samples t-test to compare the differences between baseline and T3-T4. The results are displayed in Table 3.
Baseline T1, T2, T3:
The results showed an overall effect on two scales of mathematics teaching behavior across three timepoints of the baseline main scores. The scales were ‘Clarity of instruction’ and ‘Teaching learning strategies’. There was no increase in the baseline mean scores of the other variables over time.
