
Page 182 - Functional impairment and cues for rehabilitation of head and neck cancer patients -
P. 182
Chapter 7
Model performance
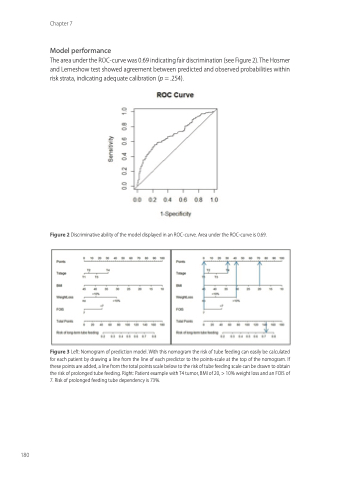
The area under the ROC-curve was 0.69 indicating fair discrimination (see Figure 2). The Hosmer and Lemeshow test showed agreement between predicted and observed probabilities within risk strata, indicating adequate calibration (p = .254).
Figure 2 Discriminative ability of the model displayed in an ROC-curve. Area under the ROC-curve is 0.69.
Internal validation
Shrinkage factors per predictor, assessed by means of bootstrapping analysis with 200 repetitions, are listed in Table 2. These factors indicate the difference between the mean regression coefficient of the 200 bootstrap samples and the initial model. For future use of the model, the regression coefficients after shrinkage should be used. In order to easily estimate the probability of prolonged feeding tube dependency per patient, a nomogram after shrinkage is provided in Figure 3.
Figure 3 Left: Nomogram of prediction model. With this nomogram the risk of tube feeding can easily be calculated for each patient by drawing a line from the line of each predictor to the points-scale at the top of the nomogram. If these points are added, a line from the total points scale below to the risk of tube feeding scale can be drawn to obtain the risk of prolonged tube feeding. Right: Patient example with T4 tumor, BMI of 20, > 10% weight loss and an FOIS of 7. Risk of prolonged feeding tube dependency is 73%.
180
