
Page 179 - Functional impairment and cues for rehabilitation of head and neck cancer patients -
P. 179
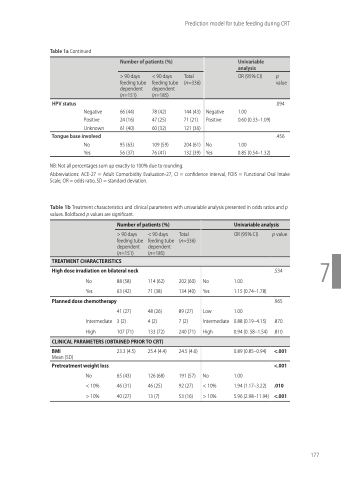
Table 1a Continued
NB: Not all percentages sum up exactly to 100% due to rounding.
Abbreviations: ACE-27 = Adult Comorbidity Evaluation-27, CI = confidence interval, FOIS = Functional Oral Intake Scale, OR = odds ratio, SD = standard deviation.
Table 1b Treatment characteristics and clinical parameters with univariable analysis presented in odds ratios and p values. Boldfaced p values are significant.
Prediction model for tube feeding during CRT
    Number of patients (%)
   Univariable analysis
    > 90 days feeding tube dependent (n=151)
  < 90 days feeding tube dependent (n=185)
   Total (n=336)
 OR (95% CI)
 p
value
   HPV status
Negative Positive Unknown
Tongue base involved
No Yes
66 (44) 24 (16) 61 (40)
95 (63) 56 (37)
78 (42) 47 (25) 60 (32)
109 (59) 76 (41)
144 (43) 71 (21) 121 (36)
204 (61) 132 (39)
Negative Positive
No Yes
1.00
0.60 (0.33–1.09)
1.00
0.85 (0.54–1.32)
.094
.456
      Number of patients (%)
Univariable analysis
      > 90 days feeding tube dependent (n=151)
< 90 days feeding tube dependent (n=185)
Total (n=336)
OR (95% CI)
p value
       TREATMENT CHARACTERISTICS
    High dose irradiation on bilateral neck
No 88 (58)
114 (62) 71 (38)
48 (26) 4 (2) 133 (72)
202 (60) 134 (40)
89 (27) 7 (2) 240 (71)
24.5 (4.6)
191 (57) 92 (27) 53 (16)
No 1.00
.534
.965
7
Yes
Planned dose chemotherapy
Intermediate High
63 (42)
41 (27) 3 (2) 107 (71)
Yes
1.15 (0.74–1.78)
 CLINICAL PARAMETERS (OBTAINED PRIOR TO CRT)
Low 1.00
Intermediate High
0.88 (0.19–4.15) .870 0.94 (0. 58–1.54) .810
0.89 (0.85–0.94) <.001
   BMI
Mean (SD)
Pretreatment weight loss
No
< 10% > 10%
23.3 (4.5)
65 (43) 46 (31) 40 (27)
25.4 (4.4)
126 (68) 46 (25) 13 (7)
<.001 1.94 (1.17–3.22) .010
5.96 (2.98–11.94) <.001
 No 1.00 < 10%
> 10%
 177
