
Page 66 - Physico-Chemical Niche Conditions for Bone Cells
P. 66
Shear stress modulates osteoblast cell and nucleus shape
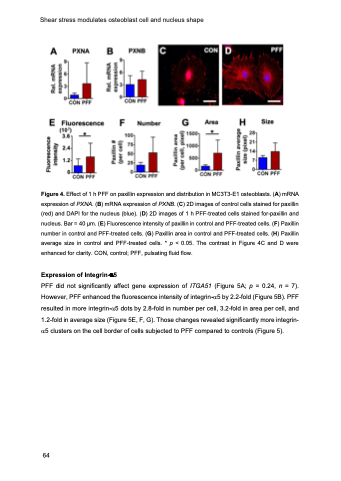
Figure 4. Effect of 1 h PFF on paxillin expression and distribution in MC3T3-E1 osteoblasts. (A) mRNA expression of PXNA. (B) mRNA expression of PXNB. (C) 2D images of control cells stained for paxillin (red) and DAPI for the nucleus (blue). (D) 2D images of 1 h PFF-treated cells stained for-paxillin and nucleus. Bar = 40 μm. (E) Fluorescence intensity of paxillin in control and PFF-treated cells. (F) Paxillin number in control and PFF-treated cells. (G) Paxillin area in control and PFF-treated cells. (H) Paxillin average size in control and PFF-treated cells. * p < 0.05. The contrast in Figure 4C and D were enhanced for clarity. CON, control; PFF, pulsating fluid flow.
Expression of Integrin-a5
PFF did not significantly affect gene expression of ITGA51 (Figure 5A; p = 0.24, n = 7). However, PFF enhanced the fluorescence intensity of integrin-a5 by 2.2-fold (Figure 5B). PFF resulted in more integrin-a5 dots by 2.8-fold in number per cell, 3.2-fold in area per cell, and 1.2-fold in average size (Figure 5E, F, G). Those changes revealed significantly more integrin- a5 clusters on the cell border of cells subjected to PFF compared to controls (Figure 5).
64
