
Page 32 - 89Zr-Immuno-PET:Towards a Clinical Tool to Guide Antibody-based Therapy in Cancer
P. 32
Chapter 2
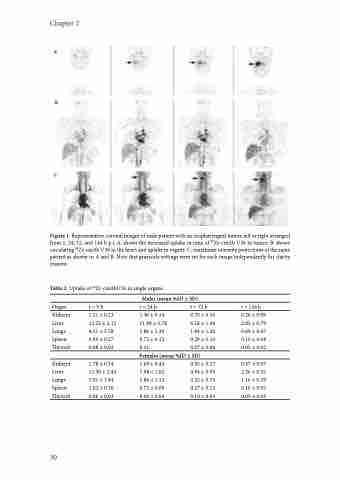
Figure 1. Representative coronal images of male patient with an oropharyngeal tumor, left to right arranged from 1, 24, 72, and 144 h p.i. A: shows the increased uptake in time of 89Zr-cmAb U36 in tumor. B: shows circulating 89Zr-cmAb U36 in the heart and uptake in organs. C: maximum intensity projections of the same patient as shown in A and B. Note that grayscale settings were set for each image independently for clarity reasons.
Table 2. Uptake of 89Zr-cmAbU36 in single organs
Organ Kidneys Liver Lungs Spleen Thyroid
Kidneys Liver Lungs Spleen Thyroid
t =0 h
1.21 ± 0.23 12.23 ± 2.12 4.51 ± 3.58 0.99 ± 0.27 0.08 ± 0.02
1.78 ± 0.34 11.50 ± 2.45 5.91 ± 1.94 1.02 ± 0.36 0.06 ± 0.03
t = 72 h 0.70 ± 0.16 6.18 ± 1.44 1.84 ± 1.20 0.29 ± 0.10 0.07 ± 0.04
t = 144 h 0.26 ± 0.09 2.83 ± 0.79 0.69 ± 0.47 0.10 ± 0.04 0.05 ± 0.02
0.37 ± 0.07 2.36 ± 0.52 1.16 ± 0.29 0.10 ± 0.05 0.05 ± 0.03
Males (mean %ID ± SD)
t = 24 h
1.36 ± 0.14
11.98 ± 0.78
5.86 ± 1.30
0.75 ± 0.12
0.11
Females (mean %ID ± SD)
1.69 ± 0.44 7.98 ± 1.02 3.86 ± 1.52 0.72 ± 0.09 0.06 ± 0.04
0.95 ± 0.27 4.94 ± 0.95 2.52 ± 0.75 0.27 ± 0.12 0.10 ± 0.03
30
