
Page 193 - 89Zr-Immuno-PET:Towards a Clinical Tool to Guide Antibody-based Therapy in Cancer
P. 193
Towards 89Zr-immuno-PET to measure target engagement of antibodies
9
191
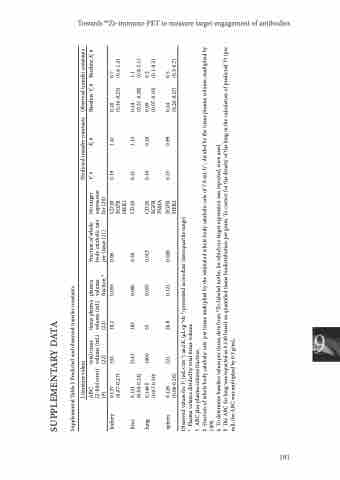
SUPPLEMENTARY DATA
Supplemental Table 1 Predicted and observed transfer constants
kidney
0.137 (0.07-0.27)
332
18.2
0.055
0.06
CD20 EGFR HER2
(0.16-0.25)
(0.4-1.3)
liver lung
0.121 (0.06-0.24)
2143 1000
183 55
0.085 0.055
0.30 0.013
CD20
0.21 0.10
1.13 0.10
0.24 (0.21-0.28)
1.1 (0.8-2.1)
spleen
0.128 (0.06-0.26)
221
26.8
0.121
0.028
(interquartile range)
EGFR HER2
0.25
0.99
0.24 (0.20-0.27)
0.5 (0.3-0.7)
Literature values
Predicted transfer constants
Observed transfer constants
ABC
(2-fold error) (9)
total tissue volume (mL) (22)
tissue plasma volume (mL) (22)
plasma volume fraction *
Fraction of whole body catabolic rate per tissue (11)
No target expression for (20)
Vt † 0.19
Ki ‡ 1.41
Baseline Vt § 0.20
Baseline Ki § 0.7
0.149 ǁ (0.07-0.30)
CD20 EGFR PSMA
0.09 (0.07-0.10)
0.2 (0.1-0.3)
Observed values for Vt (mL×cm-3) and Ki (μL×g-1×h-1) presented as median
* Plasma volume divided by total tissue volume.
† ABC plus plasma volume fraction.
‡ Fraction of whole body catabolic rate per tissue multiplied by the estimated whole body catabolic rate of 7.8 mL·h-1, divided by the tissue plasma volume, multiplied by 1000.
§ To determine baseline values per tissue, data from 89Zr-labeled mAbs, for which no target expression was reported, were used.
ǁ The ABC for lung was reported as 0.149 based on quantified tissue biodistribution per gram. To correct for the density of the lung in the calculation of predicted Vt (per ml), the ABC was multiplied by 0.3 g/mL.
