
Page 104 - 89Zr-Immuno-PET:Towards a Clinical Tool to Guide Antibody-based Therapy in Cancer
P. 104
Chapter 5
For normal tissue ACmean was derived, for tumors ACmax, ACpeak and ACmean were derived (11). All ACs were converted into standardized uptake values (SUV), correcting for injected dose and body weight.
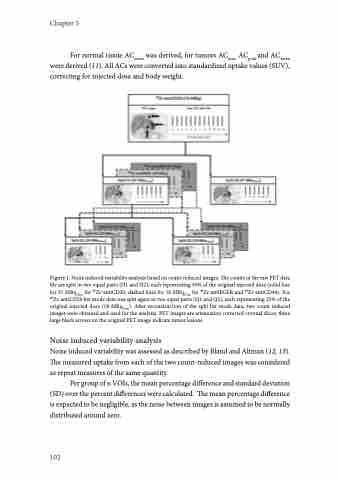
Figure 1. Noise induced variability analysis based on count-reduced images. The counts in the raw PET data file are split in two equal parts (H1 and H2), each representing 50% of the original injected dose (solid line for 37 MBq74inj for 89Zr-antiCD20, dashed lines for 18 MBq37inj for 89Zr-antiEGFR and 89Zr-antiCD44). For 89Zr-antiCD20 list mode data was split again in two equal parts (Q1 and Q2), each representing 25% of the original injected dose (18 MBq74inj). After reconstruction of the split list mode data, two count reduced images were obtained and used for the analysis. PET images are attenuation corrected coronal slices, three large black arrows on the original PET image indicate tumor lesions.
Noise induced variability analysis
Noise induced variability was assessed as described by Bland and Altman (12, 13). The measured uptake from each of the two count-reduced images was considered as repeat measures of the same quantity.
Per group of n VOIs, the mean percentage difference and standard deviation (SD) over the percent differences were calculated. The mean percentage difference is expected to be negligible, as the noise between images is assumed to be normally distributed around zero.
102
