
Page 76 - Advanced concepts in orbital wall fractures
P. 76
Chapter 4
74
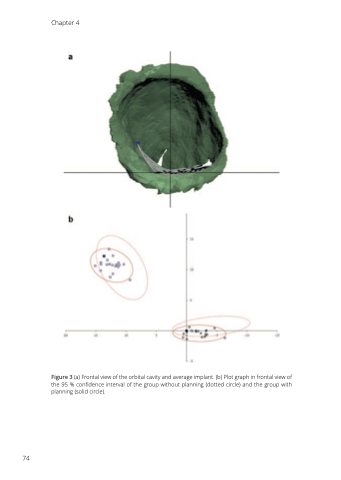
Figure 3 (a) Frontal view of the orbital cavity and average implant. (b) Plot graph in frontal view of the 95 % confidence interval of the group without planning (dotted circle) and the group with planning (solid circle).
