
Page 113 - Advanced concepts in orbital wall fractures
P. 113
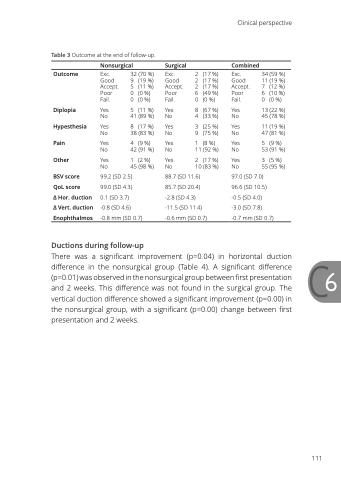
                                Table 3 Outcome at the end of follow-up.
Ductions during follow-up
(11 %)
Yes 13 (22 %) No 45 (78 %)
Yes 11 (19 %) No 47 (81 %)
Yes 5 (9 %) No 53 (91 %)
Yes 3 (5 %) No 55 (95 %)
97.0 (SD 7.0) 96.6 (SD 10.5) -0.5 (SD 4.0)
-3.0 (SD 7.8)
-0.7 mm (SD 0.7)
Yes 1
No 11 (92 %)
Yes 2 (17 %) No 10 (83 %)
88.7 (SD 11.6) 85.7 (SD 20.4) -2.8 (SD 4.3) -11.5 (SD 11.4) -0.6 mm (SD 0.7)
There was a significant improvement (p=0.04) in horizontal duction C difference in the nonsurgical group (Table 4). A significant difference 6 (p=0.01) was observed in the nonsurgical group between first presentation
and 2 weeks. This difference was not found in the surgical group. The
vertical duction difference showed a significant improvement (p=0.00) in the nonsurgical group, with a significant (p=0.00) change between first presentation and 2 weeks.
(8 %)
Clinical perspective
  Outcome
Diplopia Hypesthesia Pain
Other
BSV score
QoL score
∆ Hor. duction ∆ Vert. duction Enophthalmos
Nonsurgical
Exc. 32 (70 %)
Surgical
Exc. 2 Good 2 Accept. 2 Poor 6 Fail. 0
Yes 8 No 4
Yes 3 No 9
(17 %) (17 %) (17 %) (49 %) (0 %)
(67 %) (33 %)
(25 %) (75 %)
Combined
Exc. 34 (59 %) Good 11 (19 %)
Good 9 Accept. 5 Poor 0 Fail. 0
Yes 5
No 41 (89 %)
Yes 8 (17 %) No 38 (83 %)
Yes 4 (9 %) No 42 (91 %)
Yes 1 (2 %) No 45 (98 %)
99.2 (SD 2.5) 99.0 (SD 4.3)
0.1 (SD 3.7)
-0.8 (SD 4.6)
-0.8 mm (SD 0.7)
(19 %) (11 %) (0 %) (0 %)
Accept. 7 Poor 6 Fail. 0
(12 %) (10 %) (0 %)
  111
