
Page 97 - Balancing between the present and the past
P. 97
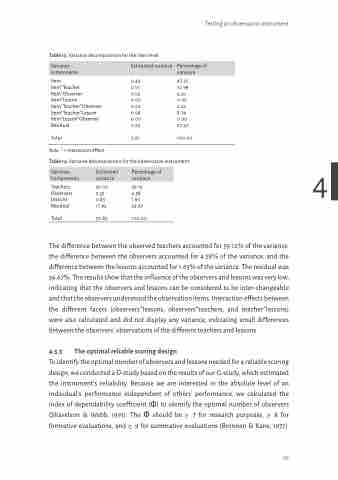
                                Table 13. Variance decomposition for the item level
Note. * = interaction effect.
Table 14. Variance decomposition for the observation instrument 4
Teachers 30.05 59.12 Observers 2.33 4.58 Lessons 0.83 1.63 Residual 17.62 34.67
Total 50.83 100.00
The difference between the observed teachers accounted for 59.12% of the variance, the difference between the observers accounted for 4.58% of the variance, and the difference between the lessons accounted for 1.63% of the variance. The residual was 34.67%. The results show that the influence of the observers and lessons was very low, indicating that the observers and lessons can be considered to be inter-changeable and that the observers understood the observation items. Interaction effects between the different facets (observers*lessons, observers*teachers, and teacher*lessons) were also calculated and did not display any variance, indicating small differences between the observers’ observations of the different teachers and lessons.
4.5.3 The optimal reliable scoring design
To identify the optimal number of observers and lessons needed for a reliable scoring design, we conducted a D-study based on the results of our G-study, which estimated the instrument’s reliability. Because we are interested in the absolute level of an individual’s performance independent of others’ performance, we calculated the index of dependability coefficient (Φ) to identify the optimal number of observers (Shavelson & Webb, 1991). The Φ should be ≥ .7 for research purposes, ≥ .8 for formative evaluations, and ≥ .9 for summative evaluations (Brennan & Kane, 1977).
Testing an observation instrument
 Variance components
  Estimated variance
 Percentage of variance
Item
Item*Teacher Item*Observer Item*Lesson Item*Teacher*Observer Item*Teacher*Lesson Item*Lesson*Observer Residual
Total
0.43 47.25 0.10 10.99 0.03 3.30 0.00 0.00 0.02 2.20 0.08 8.79 0.00 0.00 0.25 27.47
0.91 100.00
   Variance Components
  Estimated variance
 Percentage of variance
 95
