
Page 9 - Balancing between the present and the past
P. 9
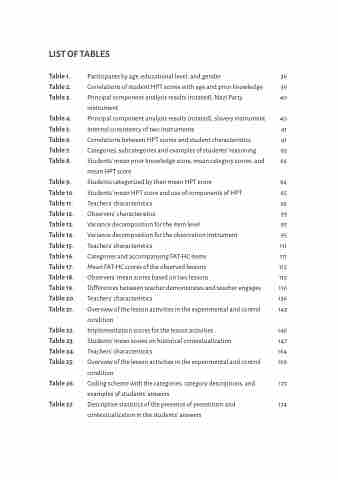
                                LIST OF TABLES
Table 1. Table 2. Table 3.
Table 4. Table 5. Table 6. Table 7. Table 8.
Table 9. Table 10. Table 11. Table 12. Table 13. Table 14. Table 15. Table 16. Table 17. Table 18. Table 19. Table 20. Table 21.
Table 22. Table 23. Table 24. Table 25.
Table 26. Table 27.
Participants by age, educational level, and gender 36 Correlations of student HPT scores with age and prior knowledge 39 Principal component analysis results (rotated), Nazi Party 40 instrument
Principal component analysis results (rotated), slavery instrument 40 Internal consistency of two instruments 41 Correlations between HPT scores and student characteristics 41 Categories, subcategories and examples of students’ reasoning 63 Students’ mean prior knowledge score, mean category scores, and 64 mean HPT score
Students categorized by their mean HPT score 64 Students’ mean HPT score and use of components of HPT 65 Teachers’ characteristics 92 Observers’ characteristics 93 Variance decomposition for the item level 95 Variance decomposition for the observation instrument 95 Teachers’ characteristics 111 Categories and accompanying FAT-HC items 111 Mean FAT-HC scores of the observed lessons 115 Observers’ mean scores based on two lessons 115 Differences between teacher demonstrates and teacher engages 116 Teachers’ characteristics 136 Overview of the lesson activities in the experimental and control 143 condition
Implementation scores for the lesson activities 146 Students’ mean scores on historical contextualization 147 Teachers’ characteristics 164 Overview of the lesson activities in the experimental and control 169 condition
Coding scheme with the categories, category descriptions, and 173 examples of students’ answers
Descriptive statistics of the presence of presentism and 174 contextualization in the students’ answers
