
Page 86 - Personality disorders and insecure attachment among adolescents
P. 86
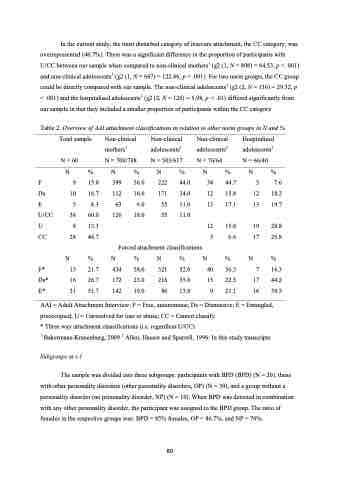
In the current study, the most disturbed category of insecure attachment, the CC category, was overrepresented (46.7%). There was a significant difference in the proportion of participants with U/CC between our sample when compared to non-clinical mothers1 (χ2 (1, N = 808) = 64.53, p < .001) and non-clinical adolescents1 (χ2 (1, N = 667) = 122.66, p < .001). For two norm groups, the CC group could be directly compared with our sample. The non-clinical adolescents2 (χ2 (2, N = 136) = 29.32, p < .001) and the hospitalised adolescents2 (χ2 (2, N = 126) = 5.98, p < .01) differed significantly from our sample in that they included a smaller proportion of participants within the CC category.
Table 2. Overview of AAI attachment classifications in relation to other norm groups in N and %
Total sample Non-clinical mothers1
N = 60 N = 700/748 N%N%N%N%N%
Non-clinical adolescents1 N = 503/617
Non-clinical adolescents2 N = 76/64
Hospitalized adolescents2 N = 66/40
                      F9 15.0 Ds 10 16.7 E5 8.3 U/CC 36 60.0 U8 13.3 CC 28 46.7
399 112 63 126
56.0 222 16.0 171 9.0 55 18.0 55
44.0 34.0 11.0 11.0
34 44.7 12 15.8 13 17.1
12 15.8 5 6.6
5 7.6 12 18.2 13 19.7
19 28.8 17 25.8
F* 13 Ds* 16 E* 31
21.7 434 26.7 172 51.7 142
58.0 321 23.0 216 19.0 80
52.0 40 56.3 35.0 15 22.5 13.0 9 21.1
7 16.3 17 44.2 16 39.5
Forced attachment classifications N%N%N%N%N%
AAI = Adult Attachment Interview; F = Free, autonomous; Ds = Dismissive; E = Entangled, preoccupied; U = Unresolved for loss or abuse; CC = Cannot classify
* Three way attachment classifications (i.e. regardless U/CC)
1 Bakermans-Kranenburg, 2009 2 Allen, Hauser and Spurrell, 1996: In this study transcripts
Subgroups at t-1
The sample was divided into three subgroups: participants with BPD (BPD) (N = 20), those with other personality disorders (other personality disorders, OP) (N = 30), and a group without a personality disorder (no personality disorder, NP) (N = 10). When BPD was detected in combination with any other personality disorder, the participant was assigned to the BPD group. The ratio of females in the respective groups was: BPD = 85% females, OP = 86.7%, and NP = 70%.
 80
