
Page 124 - Comprehensive treatment of patients with glucocorticoid-dependent severe asthma
P. 124
Chapter 7
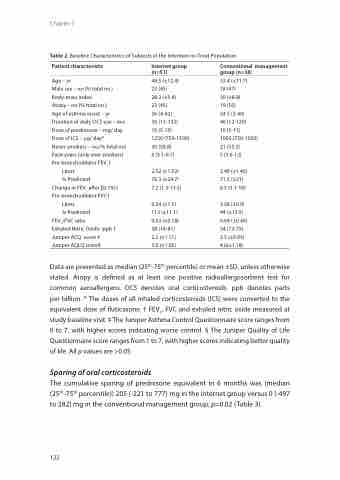
Table 2. Baseline Characteristics of Subjects in the Intention-to-Treat Population
Patient characteristic
Age – yr
Male sex – no.(% total no.) Body-mass index
Atopy – no.(% total no.)
Age of asthma onset – yr Duration of daily OCS use – mo. Dose of prednisone – mg/ day Dose of ICS – mg/ day*
Never smokers – no.(% total no) Pack-years (only ever smokers) Pre-bronchodilator FEV1†
Liters
% Predicted
Change in FEV1 after β2 (%)† Pre-bronchodilator FVC†
Liters
% Predicted FEV1/FVC ratio
Exhaled Nitric Oxide- ppb † Juniper ACQ score ‡ Juniper AQLQ score§
Internet group (n=51)
48.5 (±12.4) 23 (45)
28.3 (±5.4) 23 (45)
26 (4-42)
36 (12-132)
10 (5-15)
1250 (750-1500) 30 (58.8)
6 (3.1-9.7)
2.52 (±1.02) 76.3 (±24.7) 7.2 (1.3-13.5)
6.24 (±1.5) 113 (±11.1) 0.63 (±0.18) 38 (18-81) 2.2 (±1.11) 5.0 (±1.06)
Conventional management group (n=38)
52.4 (±11.7) 18 (47)
30 (±8.8) 19 (50)
24.5 (3-40)
46 (12-120)
10 (5-15)
1000 (750-1500) 21 (55.3)
5 (3.6-12)
2.40 (±1.42) 71.3 (±21) 8.5 (3.1-18)
3.58 (±0.9) 94 (±15.5) 0.69 (±0.49) 34 (13-75) 2.5 (±0.95) 4.6(±1.18)
Data are presented as median (25th-75th percentile) or mean ±SD, unless otherwise stated. Atopy is defined as at least one positive radioallergosorbent test for common aeroallergens. OCS denotes oral corticosteroids. ppb denotes parts per billion. * The doses of all inhaled corticosteroids (ICS) were converted to the equivalent dose of fluticasone. † FEV1, FVC and exhaled nitric oxide measured at study baseline visit. ‡ The Juniper Asthma Control Questionnaire score ranges from 0 to 7, with higher scores indicating worse control. § The Juniper Quality of Life Questionnaire score ranges from 1 to 7, with higher scores indicating better quality of life. All p values are >0.05.
Sparing of oral corticosteroids
The cumulative sparing of prednisone equivalent in 6 months was (median (25th-75th percentile)) 205 (-221 to 777) mg in the internet group versus 0 (-497 to 282) mg in the conventional management group; p=0.02 (Table 3).
122
