
Page 81 - Second language development of newly arrived migrant kindergarteners - Frederike Groothoff
P. 81
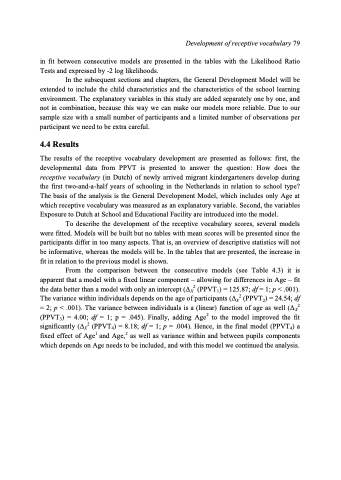
Figure 4.2: Graphical Representation of the General Development Model of PPVT with 80% Reliability11. Figure 4.2 shows that the effect of Age on PPVT scores is significant. The growth shows a quadratic slope which means that the increase in vocabulary scores is larger for younger pupils compared to older pupils. The variance within pupils (represented by the striped lines in Figure 4.2) also depends on age; we can give a more precise estimate of the vocabulary development for older pupils as compared to younger pupils. The variance between individuals (represented by the dotted lines in Figure 4.2) is a function of Age as well; the variance between older pupils is smaller than the variance between younger pupils. Then, Exposure to Dutch at School, measured as the number of months a pupil has attended a Dutch school (excluding summer months), was added to the General development Model in order to see what the effect of Exposure to Dutch at School was. A likelihood ratio test showed that the main effect of Exposure to Dutch at School contributed significantly to the fit of the model to the observed data (ΔΧ2 (PPVT7) = 24.71; df = 1; p < .001). The same holds for the interaction between Age and Exposure to Dutch at School (ΔΧ2 (PPVT8) = 50.17; df = 1; p < .001; see Table 4.4). 11 The striped lines indicate the within pupils variance of the score. The dotted lines indicate the between pupils variance of the score. With an 80% reliability the scores would fall within these areas. Development of receptive vocabulary 81 90 85 80 75 70 65 60 55 50 45 40 Growth PPVT 80% within - 80% within + 80% between - 80% between + Age in Months 48 51 54 57 60 63 66 69 72 75 78 81 84 87 90 93 96 99 102 PPVT score
