
Page 112 - Second language development of newly arrived migrant kindergarteners - Frederike Groothoff
P. 112
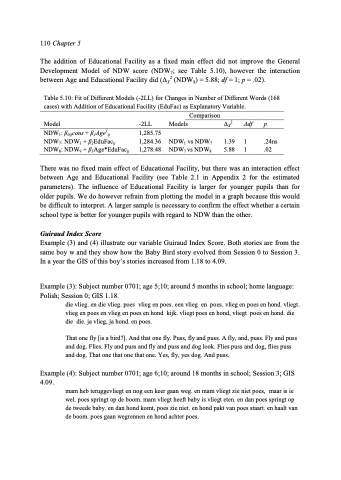
112 Chapter 5 7 6 5 4 3 2 1 0 Growth GIS Within 80% - Within 80% + Between 80% - Between 80% + Age in months Figure 5.6: Graphical Representation of the General Development Model of GIS with 80% Reliability. Figure 5.6 shows that in the effect of Age on GIS is significant. Figure 5.6 also shows that differences between individuals (represented by the dotted lines in Figure 5.6) are a function of Age; differences between younger children proved to be relevant (and significant), however the differences between children appeared to diminish with age. First, Exposure to Dutch at School was added to the model. A likelihood ratio test showed that the main effect of Exposure to Dutch at School contributed significantly to the fit of the model to the observed data (ΔΧ2 (GIS5) =12.38; df = 1; p < .001; see Table 5.12): the longer the Exposure to Dutch at School the higher the score of GIS. No interaction between Age and Exposure to Dutch at School was found (GIS6). The difference in GIS when Exposure to Dutch at School was taken into account is graphically presented in Figure 5.7 (see Table 2.2 in Appendix 2 for the estimated parameters). Table 5.12: Fit of Different Models (-2LL) for Changes in Guiraud Index Score (168 cases) with Addition of Exposure to Dutch at School (EDS) as Explanatory Variable. Comparison 349.72 GISDEF vs GIS5 346.41 GIS5 vs GIS6 ΔΧ2 Δdf 12.38 1 3.31 1 p <.001 .07ns Model GISDEF: β0ijcons + β1jAge1ij 362.10 -2LL Models GIS5: GISDEF + β2EDSij GIS6: GIS5 + β3Age*EDSij 51 54 57 60 63 66 69 72 75 78 81 84 87 90 93 96 99 102 Guiraud Index Score
