
Page 177 - Second language development of newly arrived migrant kindergarteners - Frederike Groothoff
P. 177
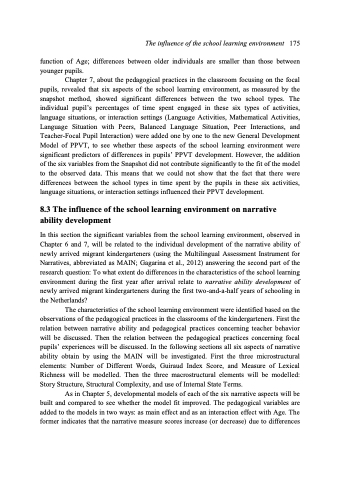
The influence of the school learning environment 177 Table 8.4: Fit of Different Polynomials (-2LL) for Changes in NDW Score (114 cases) as well as the Comparison of Consecutive Models. Comparison -2LL Models ΔΧ2 Δdf 48.08 1 0.40 2 1.87 2 1.04 1 p <.001 .82ns .39ns .31ns Model NDWa: β0ijcons a 907.83 NDWb: NDWa + β1Age1ij NDWc: NDWb + e1ijAge1ij NDWd: NDWc + u10jAge1ij NDWe: NDWb + β2Age2ij 859.75 NDWa vs NDWb 859.35 NDWb vs NDWc 857.48 NDWc vs NDWd 858.71 NDWb vs NDWeb a In addition to the intercept, variance components for differences within and between individuals are estimated. b The addition of Age2 to model NDW d did not converge within 250 iterations, hence Age2 is added to NDWb since models c and d where not significant anyway. Therefore, models NDWb and NDWe are compared with each other. Based on this General Development Model we constructed Figure 8.3, in which both the average development as well as the differences within and between individuals are represented (see Table 6.3 in Appendix 6 for the parameter estimates). The average NDW score at the age of 73 months was estimated as 37.37. Each month a child grew older, his NDW score increased by 0.63 55 50 45 40 35 30 25 20 Growth NDW Within 80% - Within 80% + Between 80% - Between 80% + Age in Months Figure 8.3: Graphical Representation of the General Development Model NDW (114 cases) with 80% Reliability. 51 55 59 63 67 71 75 79 83 87 91 95 99 103 Number of Different Words
