
Page 108 - Bladder Dysfunction in the Context of the Bladder-Brain Connection - Ilse Groenendijk.pdf
P. 108
106
Chapter 5
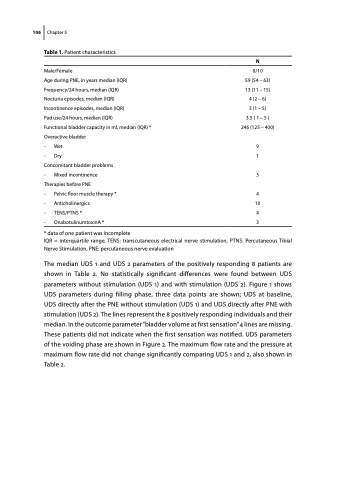
Table 1. Patient characteristics
N
Male/Female
0/10
Age during PNE, in years median (IQR)
59 (54 – 63)
Frequency/24 hours, median (IQR)
13 (11 – 15)
Nocturia episodes, median (IQR)
4 (2 – 6)
Incontinence episodes, median (IQR)
3 (1 – 5)
Pad use/24 hours, median (IQR)
3.5 ( 1 – 5 )
Functional bladder capacity in ml, median (IQR) *
246 (125 – 400)
Overactive bladder
- Wet
9
- Dry
1
Concomitant bladder problems
- Mixed incontinence
3
Therapies before PNE
- Pelvic floor muscle therapy *
4
- Anticholinergics
10
- TENS/PTNS *
4
- OnabotulinumtoxinA *
3
* data of one patient was incomplete
IQR = interquartile range, TENS: transcutaneous electrical nerve stimulation, PTNS: Percutaneous Tibial Nerve Stimulation, PNE: percutaneous nerve evaluation
The median UDS 1 and UDS 2 parameters of the positively responding 8 patients are shown in Table 2. No statistically significant differences were found between UDS parameters without stimulation (UDS 1) and with stimulation (UDS 2). Figure 1 shows UDS parameters during filling phase, three data points are shown; UDS at baseline, UDS directly after the PNE without stimulation (UDS 1) and UDS directly after PNE with stimulation (UDS 2). The lines represent the 8 positively responding individuals and their median. In the outcome parameter “bladder volume at first sensation” 4 lines are missing. These patients did not indicate when the first sensation was notified. UDS parameters of the voiding phase are shown in Figure 2. The maximum flow rate and the pressure at maximum flow rate did not change significantly comparing UDS 1 and 2, also shown in Table 2.
