
Page 117 - Getting the Picture Modeling and Simulation in Secondary Computer Science Education
P. 117
Assessment of Modeling and Simulation
Cheese barn 2
Mars 2
Traffic 1
Potato farm 1
Fire 2
Potato farm 2
Bank 2
Cheese barn 3
Fire 1
Cheese barn 1
Flood
Mars 1
Bank 1
Cheese barn 4
Fire 2
Trafic 2
Mars 3
Bank 3
Ohm's law
Bank 4
Potato farm 2
Cheese barn 5
Fire 3
Mars 4
Traffic 3
5
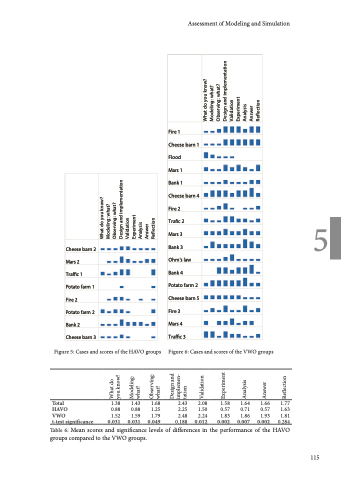
Figure 5: Cases and scores of the HAVO groups
Figure 6: Cases and scores of the VWO groups
Total
HAVO
VWO
t-test significance
1.38 1.43 0.88 0.88 1.52 1.59
0.031 0.031
1.68 1.25 1.79
0.049
2.43 2.08 2.25 1.50 2.48 2.24
0.188 0.012
1.58 1.64 1.66 1.77 0.57 0.71 0.57 1.63 1.83 1.86 1.93 1.81
0.002 0.007 0.002 0.284
Table 6: Mean scores and significance levels of differences in the performance of the HAVO groups compared to the VWO groups.
115
What do you know?
What do you know? Modeling: what? Observing: what?
Design and implementation Validation
Modeling: what?
Experiment Analysis Answer Reflection
Observing: what?
Design and implemen- tation
Validation Experiment Analysis Answer Reflection
What do you know? Modeling: what? Observing: what?
Design and implementation Validation
Experiment Analysis Answer Reflection
