
Page 59 - Biomarkers for risk stratification and guidance in heart failure
P. 59
Chapter 3
significantly higher number of patients who reached their NT-proBNP target (47% vs. 36%, p=0.117).
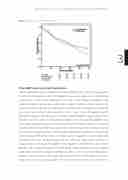
During follow-up, NT-proBNP levels and levels of urea and creatinine did not significantly differ between both treatment groups, although there was a trend for increased creatinine in the NT-proBNP-guided group (Table 6). Also, no difference was seen in QOL between the NT-proBNP-guided and the clinically-guided groups: median QOL at discharge: 47 (IQR: 34 to 62) versus 48 (IQR: 36 to 60), p=0.95, at 6-month follow-up: 23 (IQR: 10 to 39) versus 25 (IQR: 11 to 42), p=0.64, and at 12-month follow-up: 20 (IQR: 6 to 36) versus 23 (IQR: 10 to 38), p=0.6. The individualized NT-proBNP target value appeared to be of prognostic importance. Most HF-related events (64%) were preceded by off-target NT-proBNP levels at previous outpatient follow-up. Outpatient elevation of NT-proBNP levels above this individualized target value indicated an increased risk for major end points such as total mortality (hazard ratio \[HR\]: 1.84, p=0.007), cardiovascular mortality (HR: 2.53, p<0.001), and HF-related mortality (HR: 3.69, p<0.001) (Table 7).
Table 4. Use of evidence based HF medication at index admission and during follow-up by treatment group.
Admission Discharge 6-Month
NBNP Clinical NBNP Clinical NBNP Clinical
12-Month
NBNP Clinical
119(91) 110(92) 84(66)* 66(55)* 76(95) 69(55) 35(28) 35(29) 66(62) 88(87) 111(87)* 95(79)* 53(36) 58(39) 59(47) 62(52) 92(41) 97(41) 111(87)† 93(78)† 79(62) 66(55)
98(77)† 76(63)† 38(30) 33(28)
Loop diuretics ACE-I
dose
ARB
dose
β-blockers
dose
MRA
dose
ACE-I/ARB
≥50% target dose
ACE-I/ARB +β-blocker
≥50% target dose
104(60) 111(65) 71(41) 75(44) 60(45) 51(38) 28(16) 31(18) 82(63) 93(63) 96(55) 97(57) 45(28) 51(34) 28(16) 36(21) 98(35) 125(81) 94(54) 101(59) 60(35) 68(40)
69(40) 67(39) 21(12) 26(15)
169(97) 162(95) 131(93) 128(93) 112(64) 111(65) 90(64) 82(59) 60(45) 57(61) 71(91) 64(59) 31(18) 34(20) 30(21) 29(21) 98(91) 92(64) 71(65) 85(88) 139(80) 126(74) 120(85) 110(80) 47(49) 49(56) 47(32) 58(43) 92(53) 95(56) 62(44) 69(50) 99(45) 109(48) 86(31) 93(44) 138(79) 134(78) 115(82) 107(78) 104(60) 90(53) 84(60)* 67(49)*
117(67)* 98(57)* 99(70) 88(64) 37(21) 30(18) 39(28) 33(24)
Data is presented as frequency (%) or as
and MRAs the dosage is expressed as percentage of target dose. *p<0.1; †p<0.05. ACEI=angiotensin- converting enzyme inhibitor; ARB=angiotensin II receptor blocker; MRA=mineralocorticoid receptor antagonist; NBNP=NT-proBNP-guided; Clinical=clinically-guided; HF=heart failure.
58
mean(standard deviation). For ACE inhibitors, ARBs, beta-blockers
