
Page 134 - Biomarkers for risk stratification and guidance in heart failure
P. 134
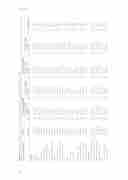
                                Prognostic impact of change in NT-proBNP versus change in eGFR.
        6
    133
 Potassium, mmol/l Urea, mmol/l Creatinine, μmol/l
eGFR, ml/min NT-proBNP, pg/ml Medication at discharge Diuretics
4.3 (0.5) 271 11.7 (8.5-16.2) 265 121 (100-162) 271 47.0 (32.6-64.0) 271 2948 (1404-5525) 271
4.3 (0.5) 55 10.8 (7.4-15.8) 53 108 (97-150) 55 51.9 (32.0-67.4) 55 2322 (1288-5517) 55
4.2 (0.4) 70 10.5 (7.9-12.9) 69 106 (88-148) 70 59.2 (41.3-68.3) 70 3441 (1733-5342) 70
4.3 (0.5)
13.9 (9.4-16.6)** ‡ 136 (109-191)**‡ 44.7 (29.0-53.0)‡ 2241 (903-5379)
69 4.4 (0.4)§
66 12.8 (9.3-17.0)§† 69 137 (108-165)§ 69 42.5 (31.1-56.4)§ 69 3115 (1646-6064)
77 0.150 77 0.001 77 <0.001 77 <0.001 77 0.115
ACE-inhibitors
ARB
ACE-inhibitors or ARB Beta blockers Aldosterone antagonists Digoxin
263 (97.0) 271 191 (70.5) 271 57 (21.0) 271 235 (86.7) 271 209 (77.1) 271 149 (55.0) 271 79 (29.2) 271
55 (100) 55 38 (69.1) 55 9 (16.4) 55 46 (83.6) 55 40 (72.7) 55 27 (49.1) 55 19 (34.5) 55
67 (95.7) 70 54 (77.1) 70 9 (12.9) 70 62 (88.6) 70 55 (78.6) 70 43 (61.4) 70 17 (24.3) 70
66 (95.7) 43 (62.3) 21 (30.4) 62 (89.9) 56 (81.2) 35 (50.7) 17 (24.6)
69 75 (97.4) 69 56 (72.7) 69 18 (23.4) 69 65 (84.4) 69 58 (75.3) 69 44 (57.1) 69 26 (33.8)
77 0.497 77 0.273 77 0.059 77 0.673 77 0.691 77 0.463 77 0.388
Outpatient visit 1 month
Mean Arterial Pressure, mmHg Heart rate, beats/minute Sodium, mmol/l
Potassium, mmol/l
84.0 (13.6) 268 76.5 (17.9) 264 138.4 (3.6) 270 4.4 (0.5) 270 10.9 (8.3-16.9) 267 130 (100-167) 271 46.1 (31.3-60.1) 271 -3.0 (-16.5-12.0) 271 2718 (1271-6051) 271
87.3 (13.9) 55 74.7 (18.1) 55 138.9 (2.9) 55 4.2 (0.4) 55 8.9 (6.6-12.1) 52 102 (87-137) 55 56.7 (38.0-73.7) 55 10.9 (4.9-20.8) 55 1477 (672-3245) 55
82.7 (11.6)* 70 74.0 (16.1) 67 137.9 (3.6) 70 4.6 (0.5)* 70 11.1 (8.4-17.4)* 70 130 (102-161)* 70 46.4 (33.5-60.6)* 70 -14.6 (-24.9 - -6.7)* 70 1649 (850-3235) 70
85.8 (14.8)
78.2 (17.4)
138.9 (4.1)
4.3 (0.6)‡
10.3 (8.0-13.6)
119 (96-143)
50.9 (36.5-64.0)
17.3 (4.6-30.5)‡
3516 (1631-7703)** ‡
69 80.9(13.5)†‖
74 0.031 75 0.330 77 0.224 76 <0.001 77 <0.001 77 <0.001 77 <0.001 77 <0.001 77 <0.001
Urea, mmol/l Creatinine, μmol/l eGFR, ml/min Change eGFR, % NT-proBNP, pg/ml
69 4.5 (0.5)†‖
Change NT-proBNP, %
4.2 (-28.8 - 47.8) 271
-30.4 (-62.5 - -15.0) 55
-40.2 (-55.1- -16.0) 70
43.3 (20.1-104.7)** ‡
69 45.9 (14.7-79.0)†§
77 <0.001
* P<0.05 between group 1 and 2 ** P<0.05 between group 1 and 3 † P<0.05 between group 1 and 4 ‡ P<0.05 between group 2 and 3 § P<0.05 between group 2 and 4 ‖ P<0.05 between group 3 and 4
Values are expressed as n (%), mean (SD), or median (interquartile range)
BMI= body mass index; TIA = Transient ischemic attack ; COPD = chronic obstructive pulmonary disease; PCI = percutaneous coronary intervention; CABG = coronary artery bypass grafting; ICD = implantable cardiac defibrillator; HF = heart failure; NYHA = New York Heart Association ; LVEF = left ventricular ejection fraction; eGFR = estimated glomerular filtration rate; ACE = angiotensin-converting enzyme; ARB = angiotensin receptor blocker.
67 78.5 (19.6)
68 138.2 (3.5)
68 14.5 (10.4-23.1)†§‖
69 153 (126-209)†§‖
69 33.5 (27.1-47.1)†§ ‖
69 -16.5 (-25.0- -8.1)†‖
69 4975 (2650 - 9254)†§‖
