
Page 150 - Peri-implant health: the effect of implant design and surgical procedure on bone and soft tissue stability
P. 150
CHAPTER 6
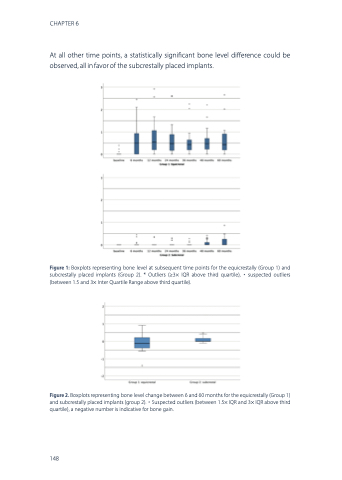
At all other time points, a statistically significant bone level difference could be observed, all in favor of the subcrestally placed implants.
Figure 1: Boxplots representing bone level at subsequent time points for the equicrestally (Group 1) and subcrestally placed implants (Group 2). * Outliers (≥3× IQR above third quartile), ◦ suspected outliers (between 1.5 and 3× Inter Quartile Range above third quartile).
Figure 2. Boxplots representing bone level change between 6 and 60 months for the equicrestally (Group 1) and subcrestally placed implants (group 2). ◦ Suspected outliers (between 1.5× IQR and 3× IQR above third quartile), a negative number is indicative for bone gain.
148
