
Page 138 - Postoperative Intra-Abdominal Adhesions- New insights in prevention and consequences
P. 138
Chapter 8
variables were compared with the student T-test. In those cases that more than three groups with continuous variables were compared the one-way ANOVA test was used. All analyses were conducted using SPSS (version 22.0.0. SPSS Inc, Chicago, USA). A P-value <0.05 (two-sided) was considered statistically significant.
Results
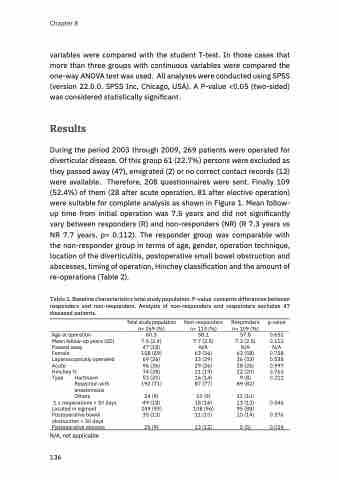
During the period 2003 through 2009, 269 patients were operated for diverticular disease. Of this group 61 (22.7%) persons were excluded as they passed away (47), emigrated (2) or no correct contact records (12) were available. Therefore, 208 questionnaires were sent. Finally 109 (52.4%) of them (28 after acute operation, 81 after elective operation) were suitable for complete analysis as shown in Figure 1. Mean follow- up time from initial operation was 7.5 years and did not significantly vary between responders (R) and non-responders (NR) (R 7.3 years vs NR 7.7 years, p= 0.112). The responder group was comparable with the non-responder group in terms of age, gender, operation technique, location of the diverticulitis, postoperative small bowel obstruction and abscesses, timing of operation, Hinchey classification and the amount of re-operations (Table 2).
Table 2. Baseline characteristics total study population. P-value concerns differences between responders and non-responders. Analysis of non-responders and responders excludes 47 diseased patients.
Age at operation
Mean follow-up years (SD) Passed away
Female
Laparoscopically operated Acute
Hinchey 3⁄4
Type Hartmann
Resection with anastomosis Others
1 ≤ reoperations < 30 days Located in sigmoid Postoperative bowel obstruction < 30 days Postoperative abscess
N/A, not applicable
Total study population n= 269 (%) 60.3
7.5 (2.4)
47 (18)
158 (59)
69 (26)
96 (36)
74 (28)
53 (20)
192 (71)
24 (9) 49 (18) 249 (93) 35 (13)
25 (9)
Non-responders n= 113 (%) 58.1
7.7 (2.5) N/A
63 (56)
33 (29)
29 (26)
21 (19)
16 (14)
87 (77)
10 (9) 18 (16) 108 (96) 11 (10)
13 (12)
Responders n= 109 (%) 57.8 7.3 (2.5) N/A
63 (58) 36 (33) 28 (26) 22 (20)
9 (8)
89 (82)
11 (10) 13 (12) 95 (88) 15 (14)
5 (5)
p-value
0.652 0.112 N/A 0.758 0.538 0.997 0.763 0.211
0.346 0.376 0.054
136
