
Page 192 - Quantitative Imaging of Small Tumours with Positron Emission Tomography
P. 192
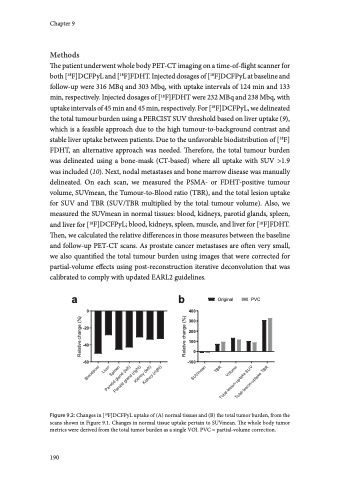
Response assessment with [18F]DCFPyL and [18F]FDHT Figure 9.3: [18F]FDHT PET-CT images of a 72-year old patient with metastatic castration-resistant prostate cancer scanned (A) before and (B) during abiraterone treatment. A PSA rise from 1436 ng/mL to 1936 ng/ mL indicated disease progression (one month after treatment start), and an accompanying increase in androgen receptor-positive disease burden is evident. PET images are shown as maximum-intensity projections. Results Visually, a substantial increase in PSMA-avid disease is apparent, accompanied by clear decreases in uptake in parotid glands, liver, spleen, and kidneys (Figure 9.1). This was in agreement with the substantial increase in measured PSMA- positive tumour volume, which increased by +134%, from 1001.3 mL to 2340.9 mL (Figure 9.2). This was accompanied by an inverse change in blood SUVmean, which decreased by 50.4%, from 0.85 to 0.42. Moreover, the SUVmean in all measured normal tissues consistently decreased by 28.6-45.7% (Figure 9.2). A less pronounced but very similar effect was noted for [18F]FDHT, where there was 9 a clear visual progression of disease, and a decrease in uptake in normal tissue and organs (Figure 9.3). This visual progression conformed to a large increase in FDHT-positive tumour volume, which increased by 61%, from 1093 mL to 1763 mL (Figure 4). Again, this was accompanied by a decrease in blood SUVmean, which decreased by 22.7%. Also, all other measured tissues demonstrated consistent decreases in uptake ranging -14.3% to -21.6% (Figure 9.4). 191
