
Page 116 - Quantitative Imaging of Small Tumours with Positron Emission Tomography
P. 116
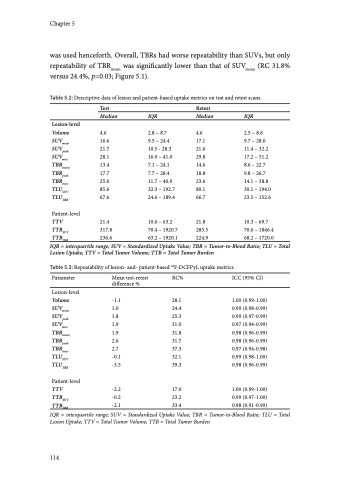
A50 40 30 20 10 -10 -20 -30 -40 -50 C50 40 30 20 10 -10 -20 -30 -40 -50 1 B50 40 +1.96xSD 60 40 20 0 -20 -40 -60 P = 0.029* SUV P = 0.06 TBR P = 0.06 Average (SUVpeak) D50 40 +1.96xSD 30 20 Average (TBRpeak) 10 100 Average (TLUTBR) Mean Peak Max Figure 5.1: Test-retest variability of SUV and TBR variants. Significant differences have been indicated with an asterix (Holms-Bonferroni corrected p-values). Differences in repeatability between SUVs and between TBRs were not significant. Repeatability of semi-automatic tumour volume measurement was 28.1%. 5 Repeatability of TLUTBR (RC 39.3%) was non-significantly lower than that of TLUSUV (RC 32.1%, p=0.08). Bland-Altman plots did not demonstrate a skewed variability, but variability of SUV and TBR tended to be less for higher values (Figure 5.2). In subgroup analysis, no significant differences between repeatability of metrics derived from bone versus lymph node metastases were observed (p=0.06-0.98). Only volume measurements had a significantly different repeatability for lesions >4.2mL versus <4.2mL (RC 17.6% and 36.8%, respectively; p=0.015). +1.96xSD 30 20 10 00 10 00 +1.96xSD -1.96xSD 10,000 10 100 1,000 -50 1 1,000 Average (Volume) -10 -20 -1.96xSD -30 -40 -1.96xSD -50 0 20 40 60 80 0 20 40 60 80 -10 -20 -1.96xSD -30 -40 Figure 5.2: Bland-Altman plots of lesion-level metrics (A) SUVpeak, (B) TBRpeak, (C) volume, and (D) TLUTBR. Y-axis in (C) and (D) were log-scaled for visual interpretation. [18F]DCFPyL PET repeatability % test-retest difference % test-retest difference % test-retest difference % test-retest difference test-retest difference % 115
