
Page 105 - Quantitative Imaging of Small Tumours with Positron Emission Tomography
P. 105
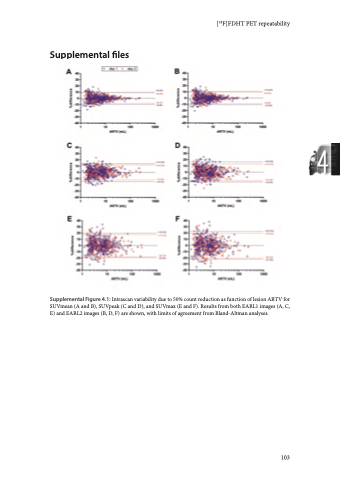
Chapter 4 Supplemental Figure 4.2: Bland-Altman graph of interscan (test-retest) variability of SUVmean (A and B), SUVpeak (C and D), and SUVmax (E and F) normalized to AUC-PP at 100% and 50% of counts. Results from both EARL1 images (left column) and EARL2 images (right column) are shown. 104
